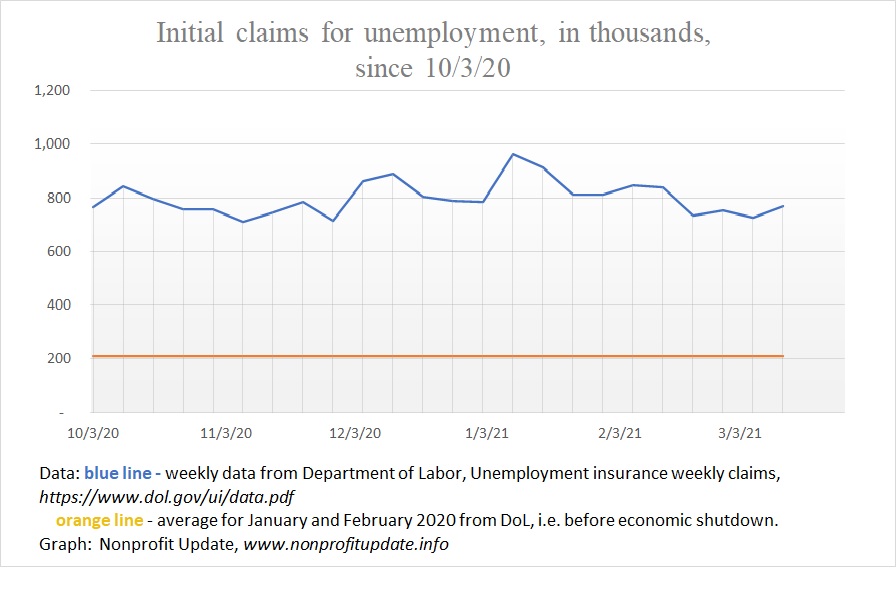
The number of new claims for unemployment for week ending 3/13/21 increased 45,000 after decling 29,000 the prior week. Those weekly changes are in the range of what has happened over the last six months. In other words, not a lot of improvement with plenty of ups and downs in the weekly new-claims tally.
Since 8/29/20, the new weekly claims ranged from a low of 711K to high of 965K. average since then is 812K. That means weekly new claims have been bad news for seven months in a row.
For context consider before the economic shutdown the new claims averaged about 220K per week, so after all these months of improvements we are still running about four times the previous norm.
Why this ongoing discussion?
If we’re going to understand what is happening in the economy we need to dive deeper into the numbers. For those of us who are CPAs providing audits and reviews, it helps us to have a deeper understanding of the overall economy.
Ponder the following graphs and you can make your own assessment.
News report
Article at Wall Street Journal on 3/18/21 reports U.S. Jobless Claims Over Near Pandemic Lows, which translated means something like massive numbers of people are losing their jobs every week but the tally is almost as non-bad as the least bad week we have seen in the last year.
Article says other indicators are suggesting the economy is improving. Expectation is that pumping $1.9 trillion into the economy will produce substantial growth by the end of the year.
The analogy that comes to mind is a 1 gallon IV of 90% glucose will give you an energy boost. Yeah, it definitely will.
The overall economy may be picking up and the stock market is doing fabulous, but the unemployment data is barely budging.
Following graphs show the ongoing devastation from the economic shutdown.
New claims
New claims for unemployment by week since the start of 2020:
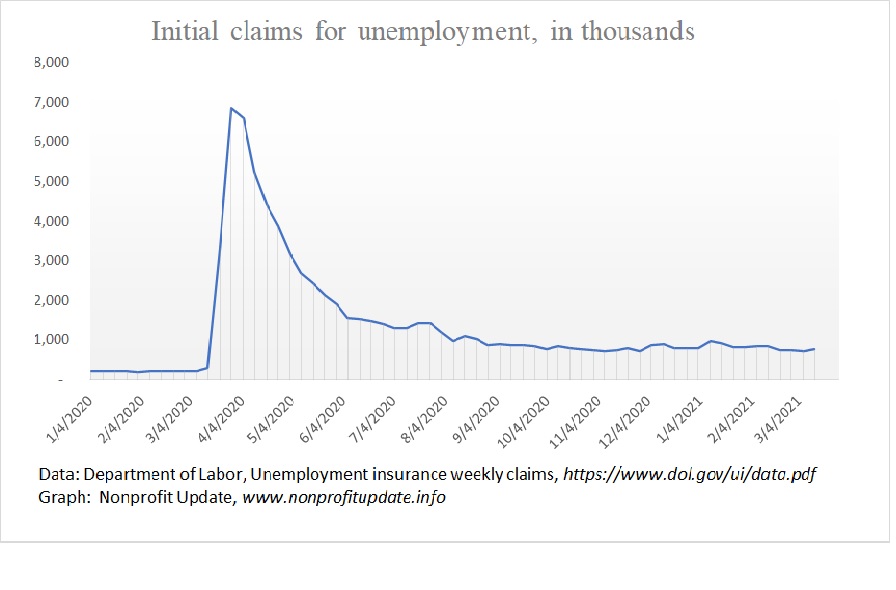
That data shows a harsh increase followed by a rapid drop. With data showing from the start of 2020, it looks like the new claims plateaued back in June and a slightly lower plateau starting in September.
Top of this post shows a graph looking closer at the new claims since 10/3/20. What I see there is a relatively flat set of claims.
Continuing claims
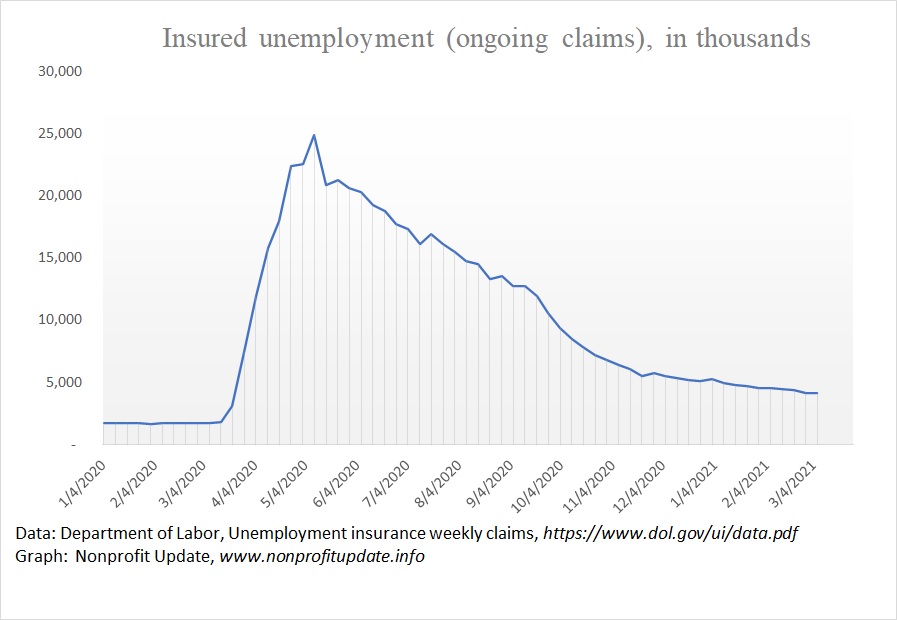
The number of people covered by unemployment insurance who are drawing checks is extremely high, but is continuing to drop, even if slowly. This is labeled as the number of insured unemployed. People going into the extended benefits program at the federal level offset a large portion of the drop.
Continuing claims since start of 2020, which shows a shallower decline than the new claims, obviously, but a plateau is visible:
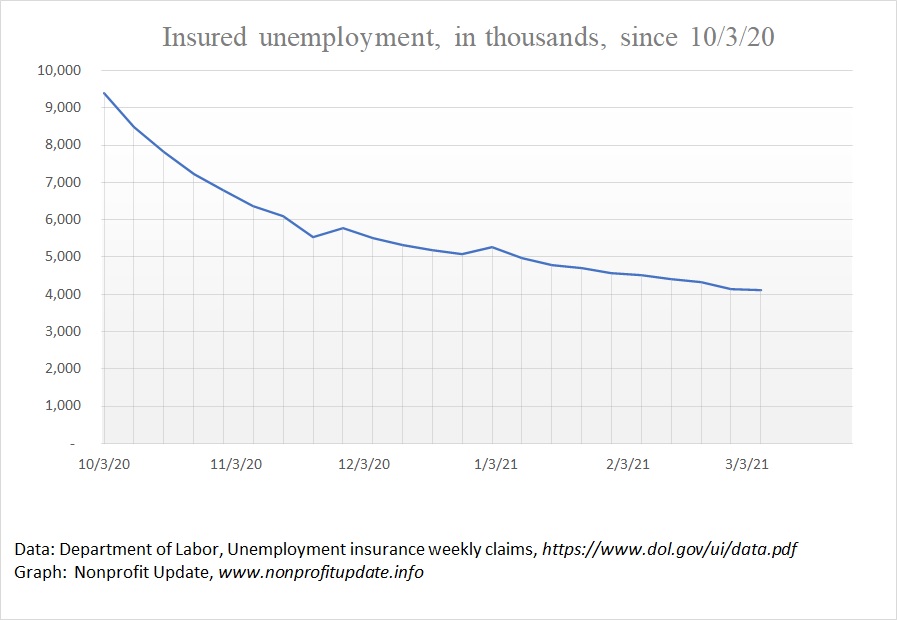
A closer look at the continuing claims at the state level only since 10/3/20:
Continuing claims in state and federal programs
When people exhaust the state level coverage, they become eligible for the extended federal benefits, called the Pandemic Emergency Unemployment Compensation program.
Tally of people who are now in the extended 13 weeks covered at the federal level is offsetting a large portion of the drop in state-level. The number of total covered unemployed is dropping only slowly.
It is of concern to me that there are large numbers of people exhausting the state coverage. That means lots of workers have gone more than 6 months without work. Unsettling issue there is a person’s skills start to deteriorate with that length of unemployment.
Graph of state coverage and extended federal coverage:
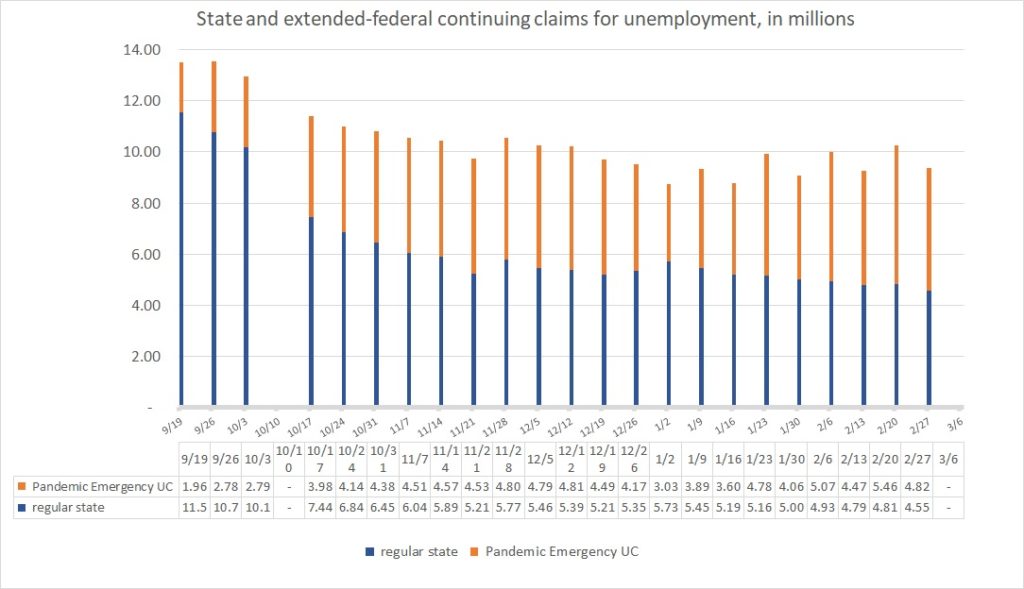
That shows a lot of up-and-down in the last 10 or 11 weeks.
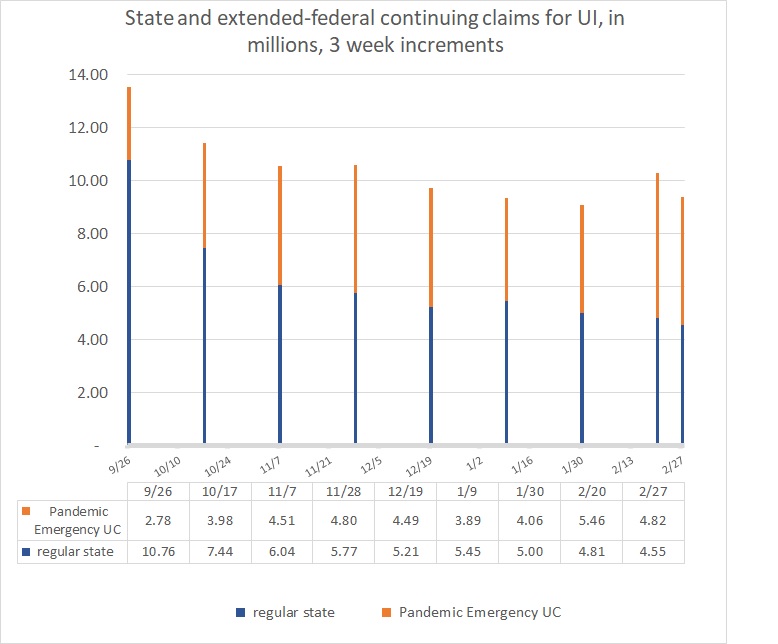
To smooth the curve, look at the combined state and federal ongoing claims in three week increments:
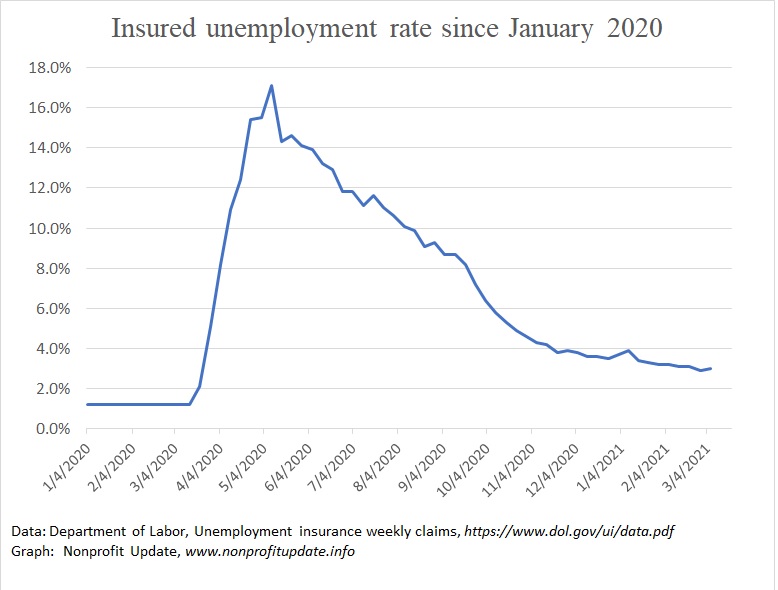
Insured unemployment rate
The proportion of people who are covered by unemployment insurance who are unemployed is also included in the weekly report. As you can see the insured unemployment rate is continuing to drop.
For a closer look, check out the insured unemployment rate since the start of October:
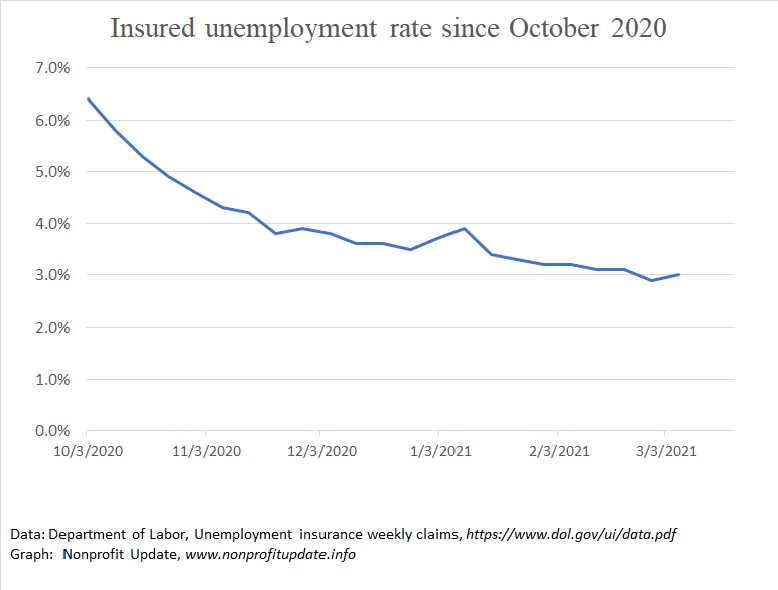
Data source
Weekly press release from the Department of labor: Unemployment insurance weekly claims. At the end of the report you can find weekly data for this year. Page 4 has a table containing all the numbers I extracted for weekly update to these tables.