The size of a bite which inflation is taking out of every meal is accelerating for those of us who are not living at the top of an ivory tower fortress inside the D.C. Beltway.
Got lunch from Jimmy John’s yesterday. They fix up yummy sandwiches.
I had turkey on French bread with provolone cheese. Split a large sandwich with my dining partner. ‘Twas delish’.
Price was $14.99. Yeah fifteen bucks for just the sandwich, to go, so nothing for the greedy state tax machine.
Last August the exact same sandwich was $12.99. Up an even $2.00.
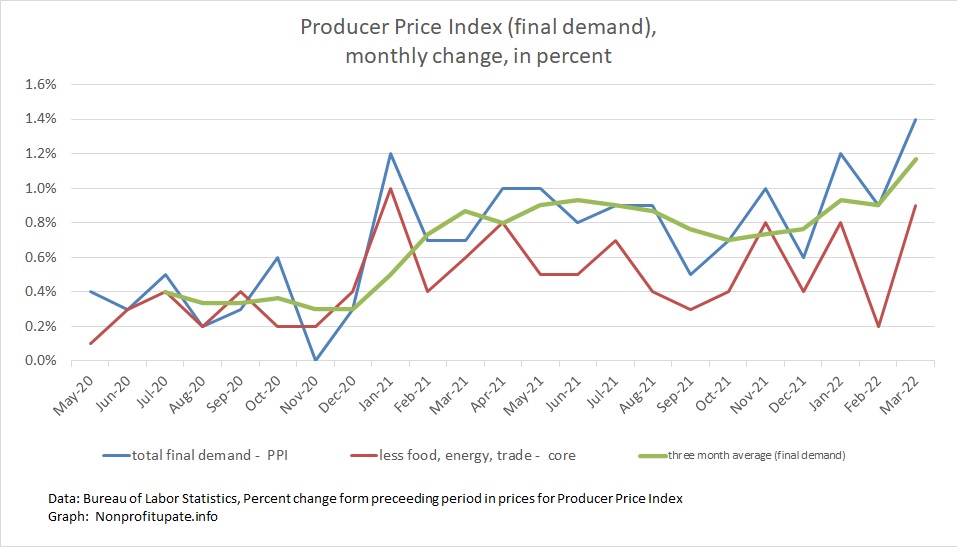
The Producer Price Index (PPI) rose 1.4% in March 2022. This follows the February increase revised up by 0.1% to 0.9%. The January increase was previously revised up by 0.2% to 1.2%.
That is 3.5% in the first quarter of 2022.
The increases are driven by strong consumer demand and constrained supply.
Powerful demand is compounded by trillions of dollars having been flooded into the economy. On the supply side, ongoing supply chain problems are compounded by things like shutting down Shanghai, a city of 27 million which takes off line all their production and stops shipping from a major port. Further restricting the supply side are also soaring energy prices due to U.S. federal policies and the war in Ukraine.
Keep in mind the prior month changes in PPI are revised as needed. This is in contrast to CPI, which is not revised.
This shows there are plenty of increases in wholesale prices, which means there is a lot of inflation heading our way because that is what producers and providers are experiencing. Those increases will hit us consumers soon.
Graph at the top of this post shows the monthly price change for total demand, final demand core (which excludes food, energy, and trade), along with three month average of the final demand.
With revisions, the year over year increase in PPI for recent months is:
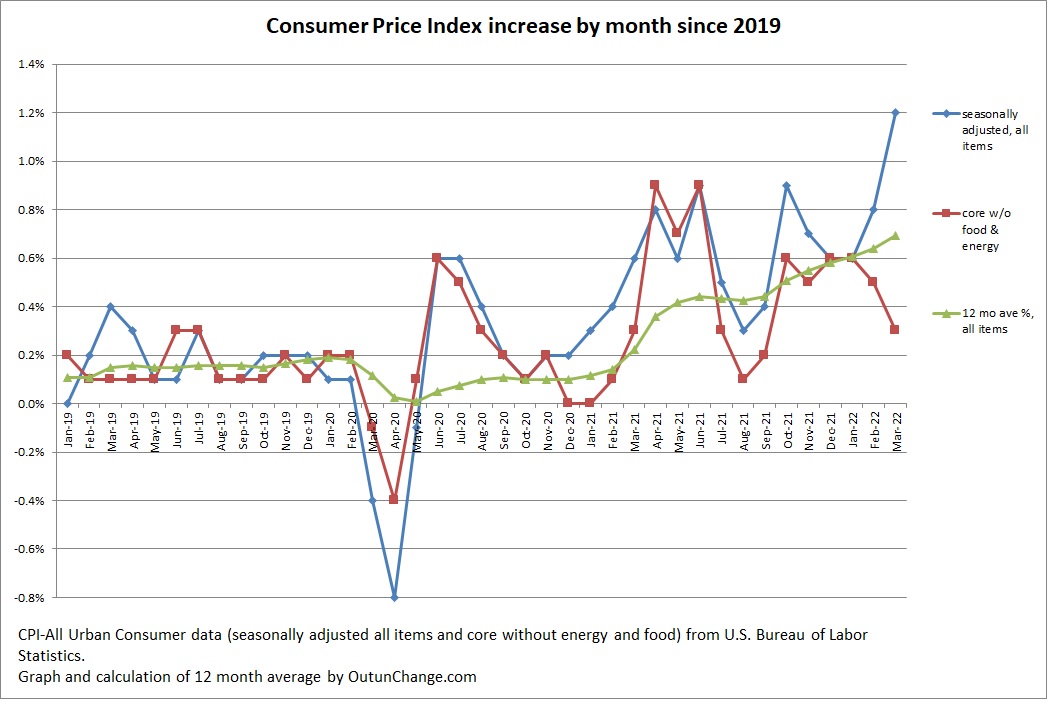
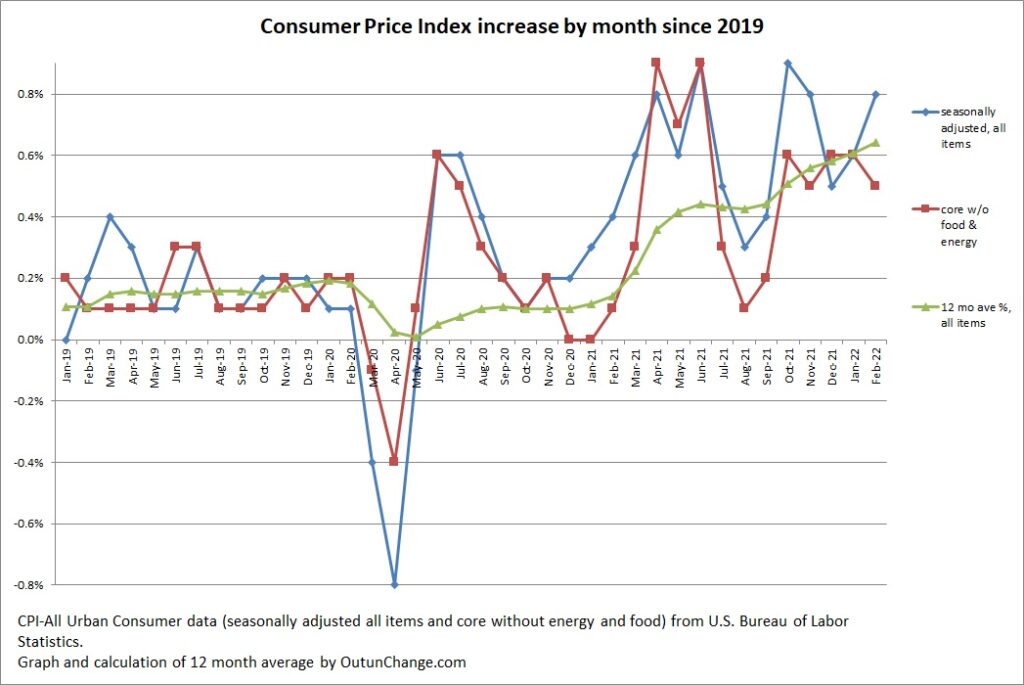
The Consumer Price Index (CPI) increased a staggering 1.2% in March 2022 after 0.8% in February
That is 2.6% for the last three months. Project three months out to a full year would be 10.4%
Graph at top of this post shows the monthly increase in the all-items index along with the core change, which excludes food and energy. Graph also shows an average of the preceding 12 months for the all-items indicator.
By the way, with the CPI accelerating the top number in all of these graphs had to be increased. That is the result of high inflation that is accelerating,
The 12 month cumulative change continues to skyrocket. The monthly change in all items index and the cumulative change for 12 months looks as follows:
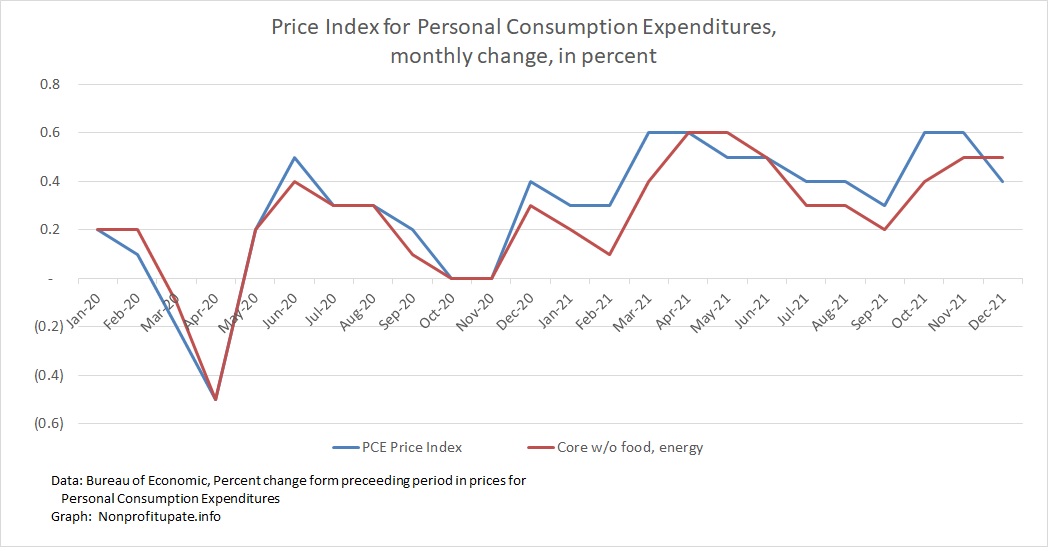
Rising PCE price index is sitting at the highest level since 1982, which is 40 years ago.
Unless you are in your 60s or older, you have little memory of inflation at this severe a level. If this sustains for a few more years, the impact will be brutal.
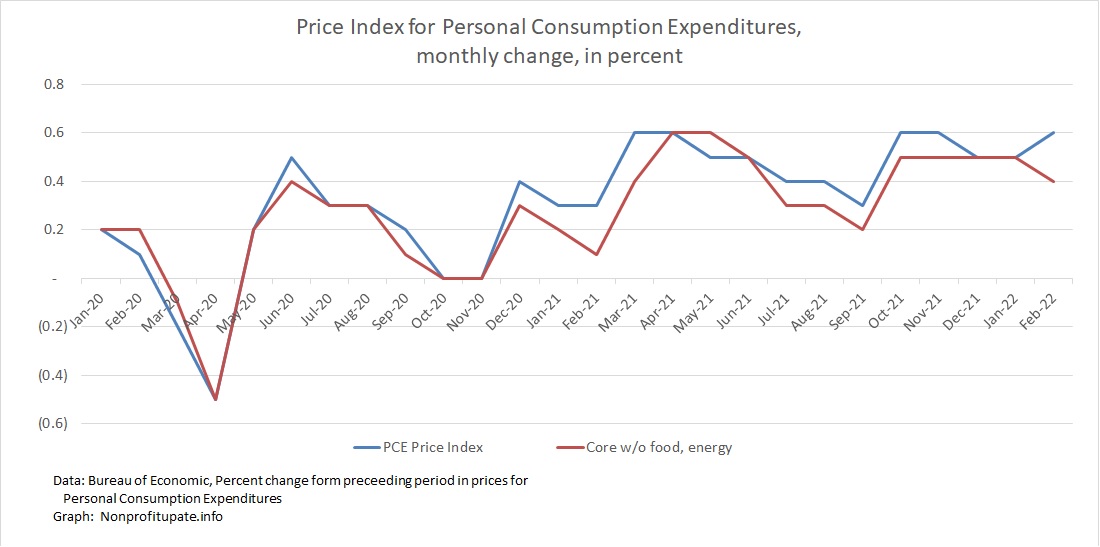
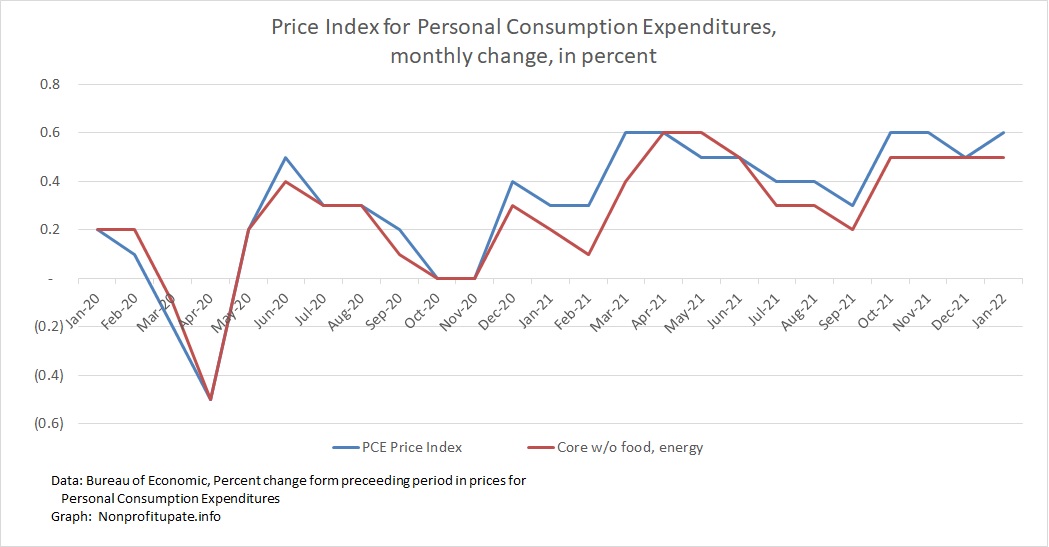
Personal Consumption Expenditure (PCE) inflation index increased 0.6%, which follows 0.5% in January 2022 which was revised downward from 0.6%.
The core PCE inflation rate (without food and energy) was 0.4% in February, following 0.5% rise in January, matching the 0.5% increase for the previous three months. The October 2021 increase was revised up 0.1%.
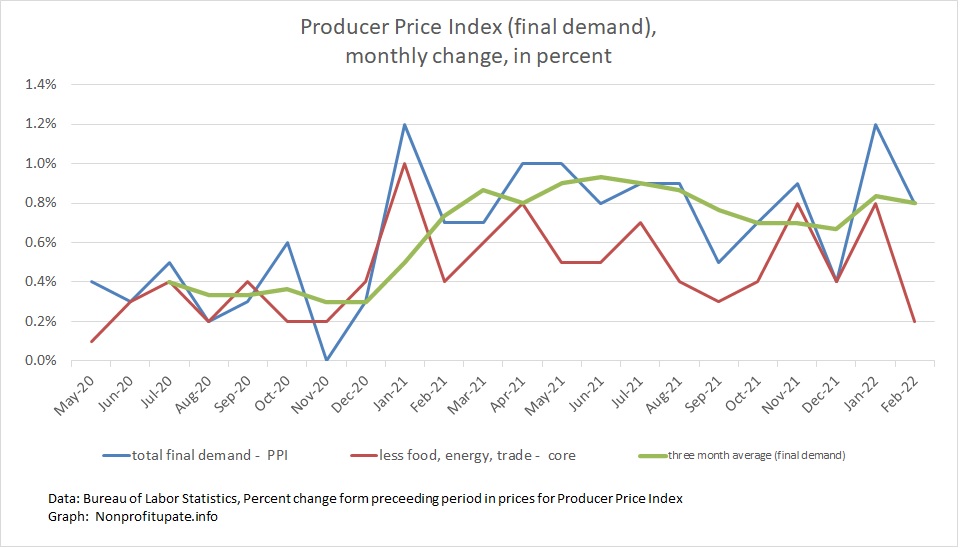
The Producer Price Index (PPI) rose 0.8% in February. The previously reported 1.0% rise in January was revised to 1.2%. So that is actually a cumulative increase of 1.0% in February
Keep in mind the prior monthly increases PPI are revised as needed. This is in contrast to CPI which is not revised.
In February, core PPI, without food, energy, & trade, was up 0.2% in February with January revised downward from 0.9% to 0.8%.
“The Producer Price Index (PPI) is a family of indexes that measures the average change over time in selling prices received by domestic producers of goods and services. PPIs measure price change from the perspective of the seller. This contrasts with other measures, such as the Consumer Price Index (CPI), that measure price change from the purchaser’s perspective. Sellers’ and purchasers’ prices may differ due to government subsidies, sales and excise taxes, and distribution costs.”
So the PPI measures prices received by producers for their goods and services. Those costs roll into the goods and services you and I buy as end consumers.
This means the increases in wholesale prices, which show a lot of inflation, are heading our way as those increases work themselves into the CPI.
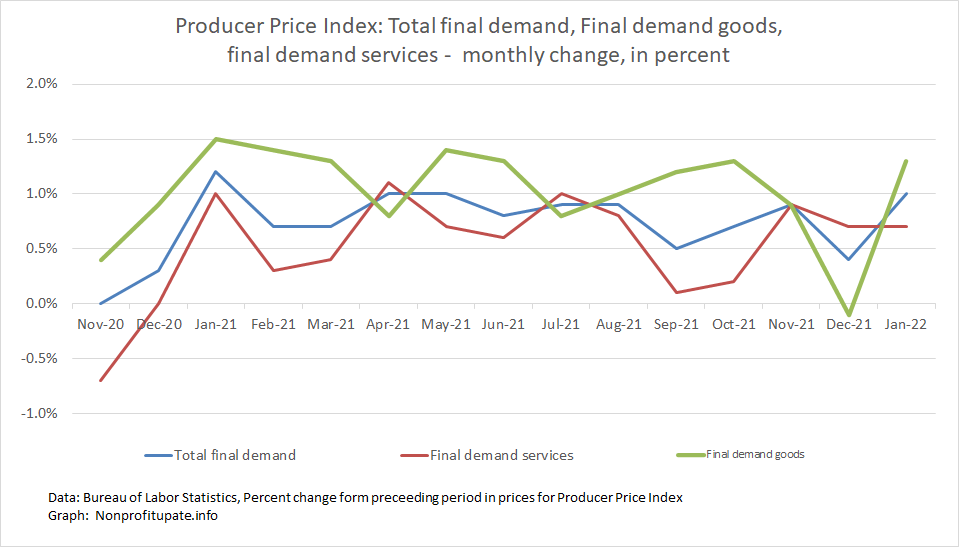
Graph at the top of this post shows the monthly price change for total demand with separate line for total demand goods and total demand services.
With revisions, the year over year increase in PPI is 10.0% in February and January, which is only a slight increase from 9.9% in December and November and the increases were just under 9.0% for October back to August.
Take a look at the year over year change in final demand and core change which means without food, energy, and trade.
The Consumer Price Index (CPI) increased 0.8% in February 2022 after increasing 0.6% in January, 0.5% in December 2021, and 0.8% in November.
That is 1.9 % for the last three months.
Graph at top of this post shows the monthly increase in the all-items index along with the core change, which excludes food and energy. Graph also shows an average of the preceding 12 months for the all-items indicator.
The 12 month cumulative change continues to skyrocket. The monthly change in all items index and the cumulative change for 12 months looks as follows:
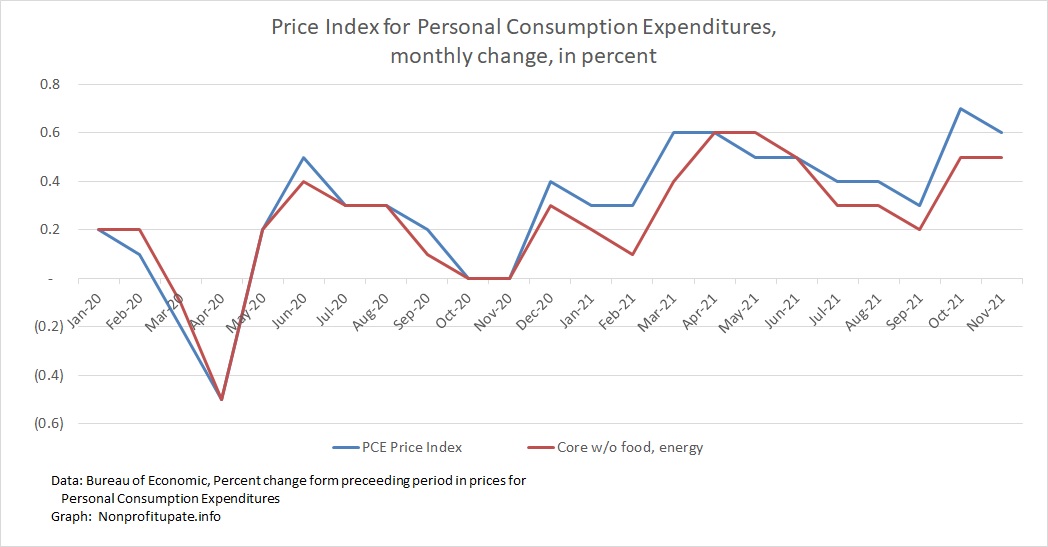
Well, the PCE increased the most in only 39 years, but that’s really close to four decades.
The headline Personal Consumption Expenditure (PCE) inflation index increased 0.6% in January 2022 following December’s increase of 0.5%, which was revised upward from previously reported 0.4%. That follows 0.6% in November and 0.6% in October 2021.
The core PCE inflation rate (without food and energy) was 0.5% in January, matching the 0.5% increase for the previous three months. The October 2021 increase was revised up 0.1%.
The cumulative 12-month change for 2021, according to BEA, is up 6.1% overall and 5.2% excluding food and energy.
The Personal Consumption Expenditure (PCE) inflation index increased 0.4% in December 20212, which is a slight decline from 0.6% in November and 0.6% in October 2021. The December increase is in line with 0.3% to 0.5% for prior five months.
The core PCE inflation rate (without food and energy) was 0.5% in December following 0.5% November and 0.4% in October
The cumulative 12-month change for 2021, according to BEA, is 5.8% overall and 4.9% excluding food and energy.
Yeah, the research wizards at the Ag Department concluded food inflation in 2021 was exact same as 2020. We will see even smaller price increases in 2022.
US Department of Agriculture – 1/28/22 – 2021 retail food price inflation continued at the same pace as 2020, but varied among food categories – In a clever disinformation effort, the alleged economists at the Economic Research Service of the U.S. Department of Agriculture claim food prices increase of 3.5% during 2021 was the same rate of increase as in 2020. The mere 3.5% during 2021 is only slightly higher than the historical average of 2% from 2000 through 2019.
In newsflash to everyone who actually buys groceries or goes to a restaurant, food prices barely increased in 2021.
(Discussion cross-posted from my other blog, Nonprofit Update, because understanding impact of high inflation on our clients helps us serve them better.)
Because of the pushback this article is already receiving, it will likely be memory-holed momentarily so I will quote a few parts of the article. Will quote the entire article at the end of this post.
The headline information:
“Retail food prices increased by 3.5 percent in 2021, equal to the rate in 2020 and greater than the historical annual average of 2.0 percent from 2000 to 2019. Of the 12 food categories depicted in the chart, six showed slower price increases in 2021 compared with 2020.”
Prices for half the food you buy are coming down. Cool, huh?
The Personal Consumption Expenditure (PCE) inflation index increased 0.6% in November. This after the 0.6% in October 2021 increase was revised upward from 0.6% to 0.7%.
The core PCE inflation rate (without food and energy) was 0.5% in November and 0.4% in October.
This indicates inflation is continuing. When you look at all of 2021 perhaps inflation is accelerating.
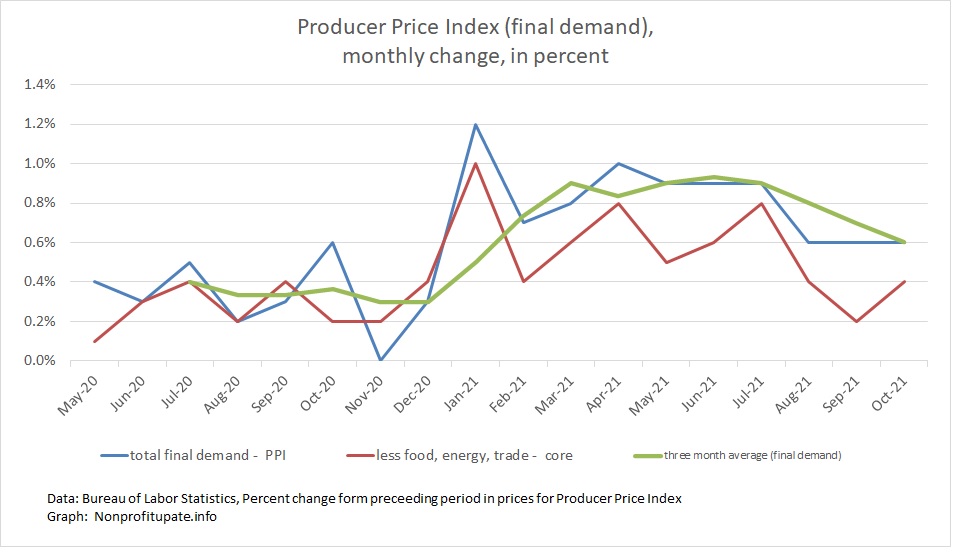
The Producer Price Index (PPI) in November 2021 shows inflation is running hot with 0.8% increase for the month.
This follows revised 0.6% for each of the three previous months (August, September, October).
I suppose this four-month run can be considered an improvement over the previous four months which were 1% in April and 0.9% in each month of May, June, and July.
That is an average of 6.5% for the last four months, down from an average of 9.25% for the preceding four months. The average monthly increase in the PPI for 2021 is a whopping 0.82%. Per month.
Graph at the top of this post shows the monthly change in final demand (the headline number) in blue. The average of the change for the latest three months is in green. The red line shows core change, which excludes food, energy, and trade.
The PPI calculation has many subcomponents, just like the CPI and PCE. Let’s look at the breakout between producer price increases for final goods and increases for final services. Following graph shows Total final demand, Final demand goods, and Final demand services. In other words the total price run up with a breakout between goods and services:
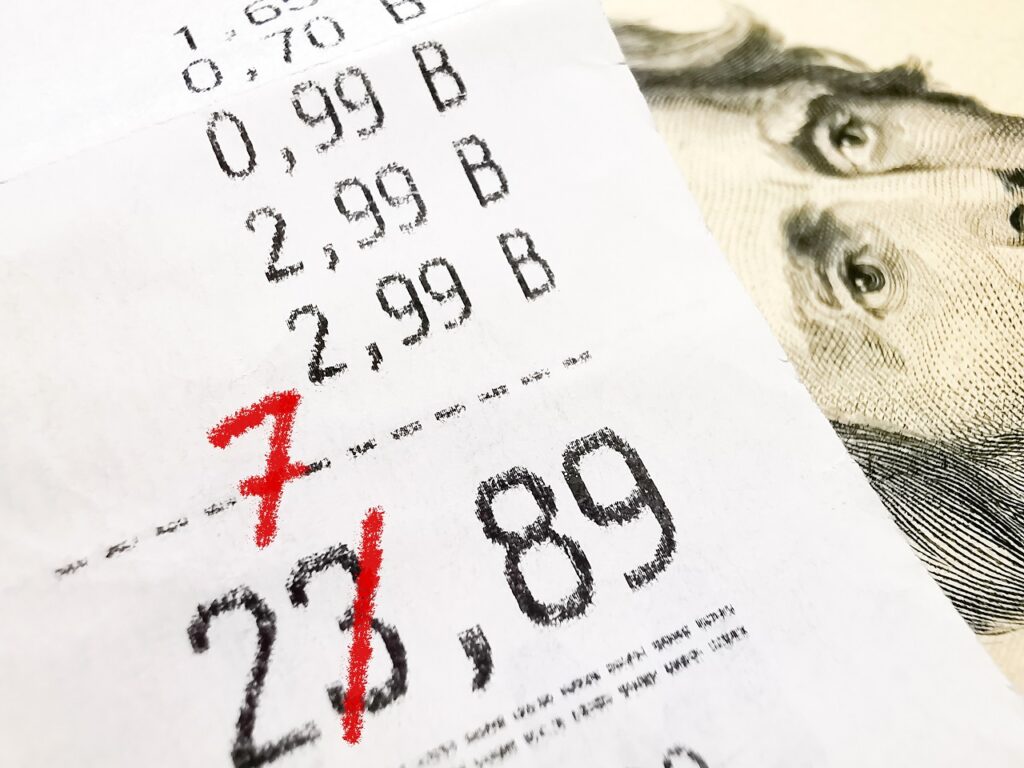
Illustration of what 5% inflation does in one year. Image courtesy of Adobe Stock.
Variety of articles are pointing towards higher inflation on the horizon. An increasing number of articles I’ve seen point towards inflationary expectations getting built into thought process of consumers and companies.
Articles for your consideration:
Kraft Heinz product line will see an average of 5% increase at the start of 2022.
Many companies are planning large raises in 2022, averaging 3.8% in one survey.
Background article by AP speculates high inflation will continue well into 2023. Other articles are providing similar speculation.
Post-Millennial – 11/9/21 – Kraft Heinz to raise prices of products up to 20% – Average price increases by Kraft Heinz for the entire product line will average 5% starting 1/9/22. Specific product lines will see dramatic increases, such as 16% for Jello and puddings, 10% for Bagel Bites, with the headliner of 20% being Mac & Cheese.
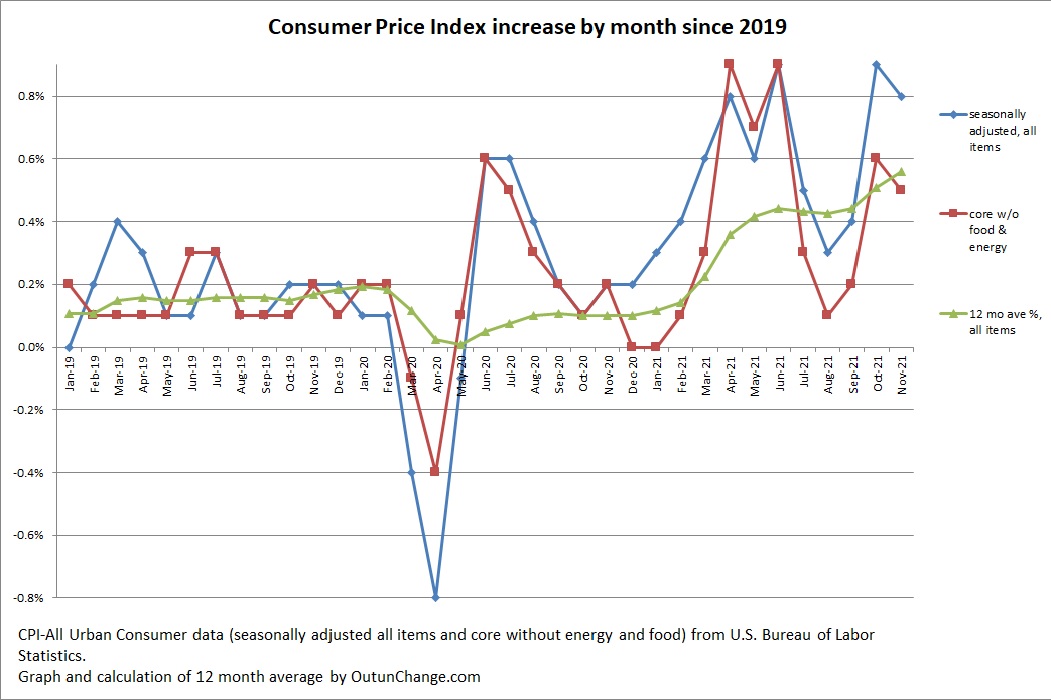
The Consumer Price Index (CPI) increased 0.8% in November after a 0.9% increase in prior month.
That is 2.1% for the last three months, which would be about 8.4% if the increase in the last three months continued for a year.
Graph at top of this post shows the monthly increase in the all-items index along with the core change, which excludes food and energy. Graph also shows an average of the preceding 12 months for the all-items indicator.
The 12 month cumulative change is distressing. The monthly change in all items index and the cumulative change for 12 months looks as follows: