Changes in the Consumer Price Index have been making a splash in the news lately. Increases over the last three months have been unusually high.
The headline consumer price indicator increased 0.6% in May after 0.8% in April and 0.6% in March. That is a big run of inflation for three months.
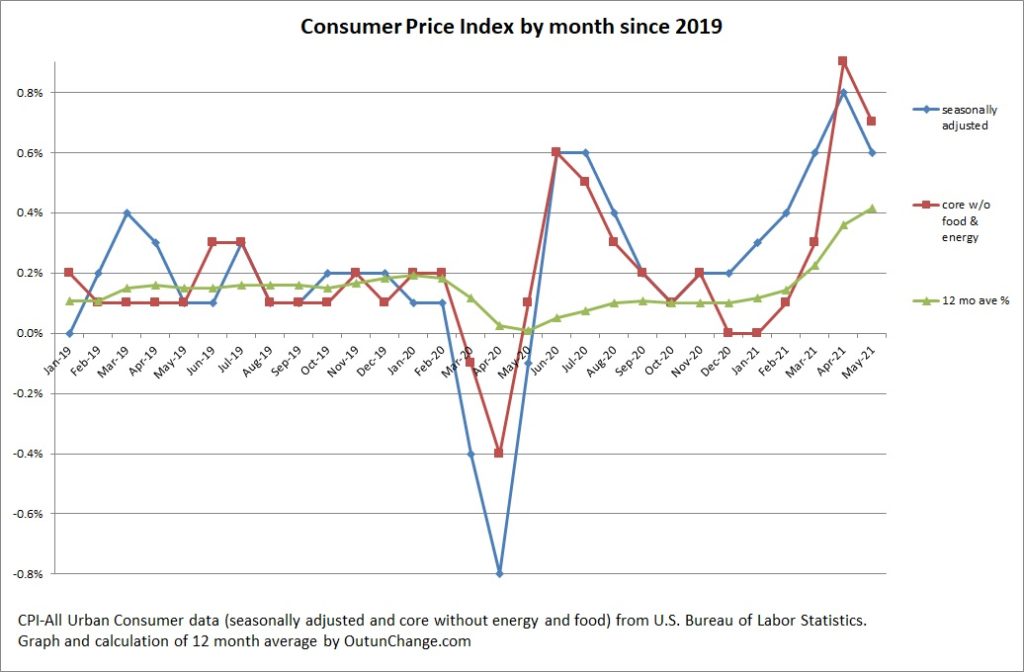
The core measure, which excludes energy and food costs, has been on a roughly parallel track with 0.7 increase in May following a 0.9% in April and 0.3% in March.
Graph at the top of this page shows the change in the primary inflation indicator, and the core index along with a 12 month average of the monthly change.
You can see a large drop in prices during the pandemic followed by spikes over the next several months. Price changes returned to normal range in the September 2020 through February 2021 timeframe.
What is behind those numbers? Let’s check out the Wall Street Journal’s narrative:
6/10/21 – Wall Street Journal – U.S. Inflation Is Highest in 13 Years as Prices Surge 5% – Of late I have noticed a lot more emphasis on the year-over-year change when news report discuss inflation rates.
Year-over-year change in the CPI is 5% in May. The core index was up 3.8% year-over-year.
Article says the biggest increase in specific components was used cars and trucks, which saw a 7.3% increase just for the month of May alone. Rise in used car prices is driven by shortfalls in new car production which is being held down by shortages of computer chips.
Rental prices of cars are soaring because of three factors:
- Rental companies sold large portion of their fleets last year when there is minimal travel so their inventory is down.
- People are resumed traveling which increases demand.
- Constrain production of new cars means the rental companies can’t fill up their inventory.
Where is inflation going?
I have no clue.
Multiple news reports say that the year-over-year change is driven by the “base effect”, which means the large drop in prices during the early pandemic is entering into the equation. Seems to me that effect is rapidly fading with the May 2020 change dropping out of the calculation. There is still some residual effect from the June and July 2020 numbers rolling into the calculation.
The “base effect” impact is supposed to mean that the current spike will fade away and will get back to the targeted 2% inflation in a few months. That is the considered opinion of the Federal Reserve.
I am a bit concerned that is not the case. I base my worry on the change in inflation over the last several months.
Look at the graph above. It shows a sharp drop in prices for several months, followed by sharp increases for several months, then settling in around the 2% rate last fall.
It is the change for the last three months that worries me. Those monthly changes are not affected by what happened last year. Three months in a row is not an encouraging change in the overall trend.
For a long time I have thought in terms of annualizing the current month inflation rate to comprehend it. If you do that with a 0.7% monthly factor that is a cringing inducing 8.4% annually.
That level of inflation is worth compounding. Multiply 0.7% by 12 and you get 8.4%. Compound that rate of inflation and it is 8.7% over a year.
What if we take a look at the last three months of changes?
Let’s check it out.
Here is a graph of the monthly change in inflation since the start of 2019. I compounded the three-month change to see a smoothed out rate. You can see this smooths out the sharp drop last spring and the sharp increase late summer.
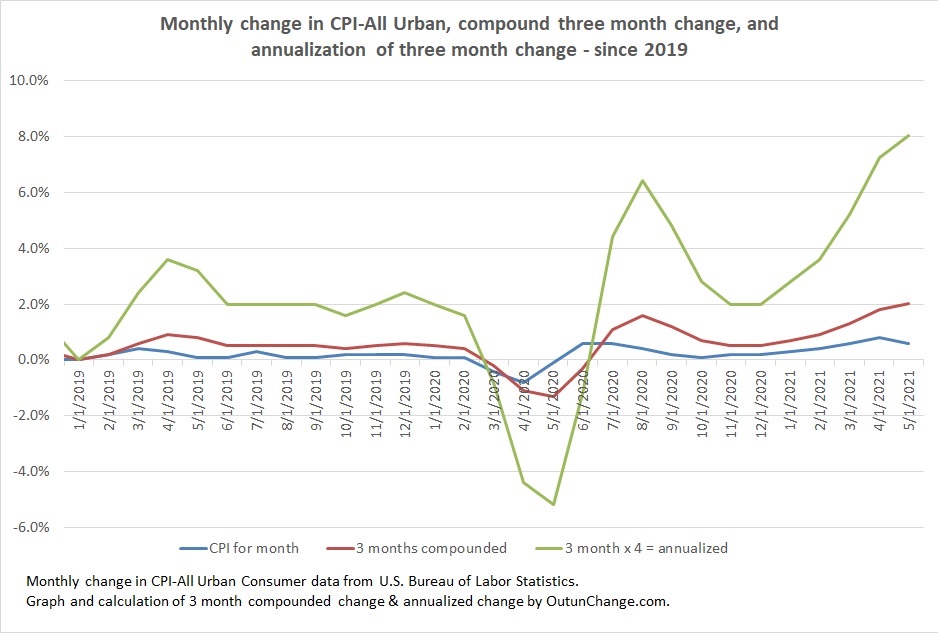
This leaves us with about 2% for three months in April and May. If we annualize that by multiplying the three month calculation by four, we see a smoothed out annualized rate of change for the latest three months.
Using that way of looking at the inflation rate, we’re sitting at annualized 8% for the three months ending May 2021. That removes the price swings of last year
My calculation for the last four months:
- 3.61% – February
- 5.22% – March
- 7.24% – April
- 8.05% – May
You can see the acceleration.
Annualizing the monthly inflation numbers is unsettling.
We all need to keep a close eye on inflation rates. That level of inflation, if it continues, would be corrosive.