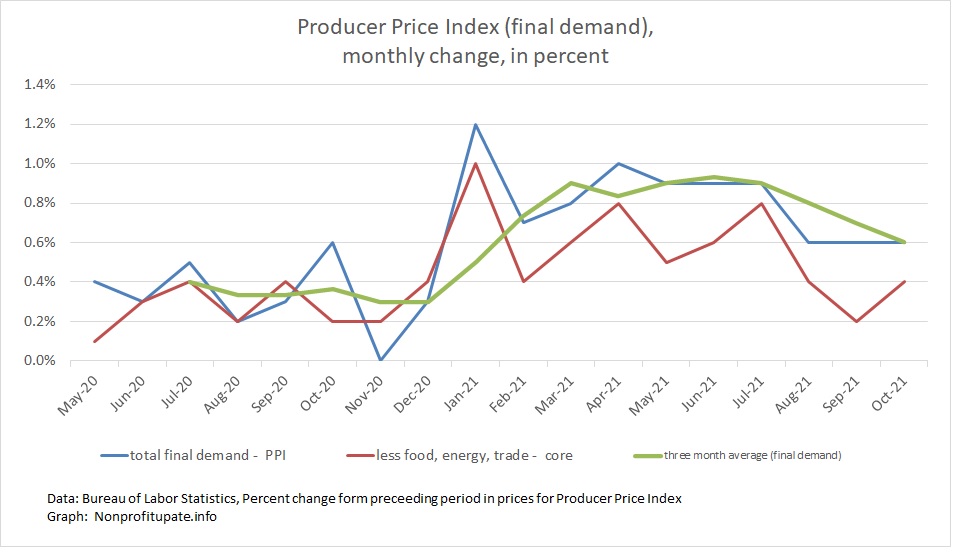
The Producer Price Index (PPI) in November 2021 shows inflation is running hot with 0.8% increase for the month.
This follows revised 0.6% for each of the three previous months (August, September, October).
I suppose this four-month run can be considered an improvement over the previous four months which were 1% in April and 0.9% in each month of May, June, and July.
That is an average of 6.5% for the last four months, down from an average of 9.25% for the preceding four months. The average monthly increase in the PPI for 2021 is a whopping 0.82%. Per month.
Graph at the top of this post shows the monthly change in final demand (the headline number) in blue. The average of the change for the latest three months is in green. The red line shows core change, which excludes food, energy, and trade.
The PPI calculation has many subcomponents, just like the CPI and PCE. Let’s look at the breakout between producer price increases for final goods and increases for final services. Following graph shows Total final demand, Final demand goods, and Final demand services. In other words the total price run up with a breakout between goods and services:
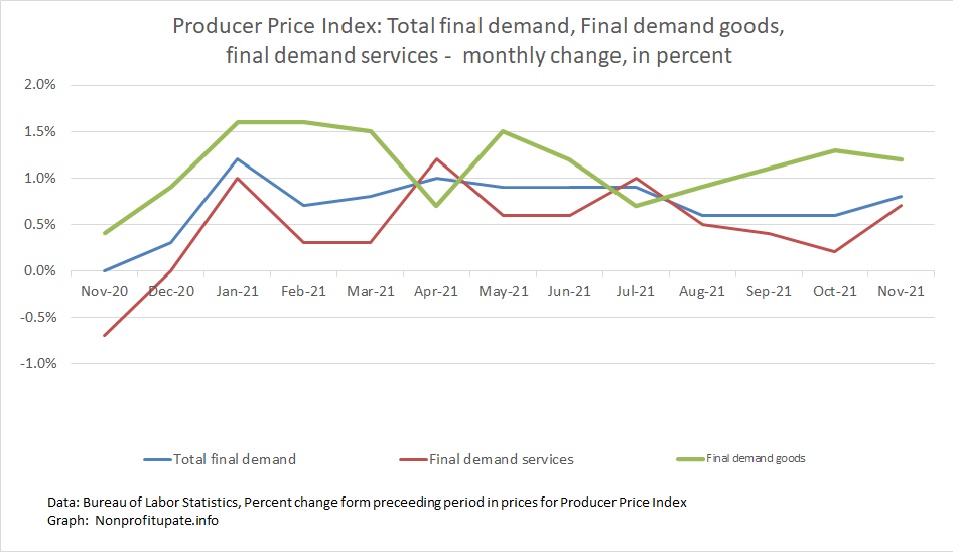
The twelve month change is final demand goods is a whopping 14.2%. The year-over-year change in final demand services is “merely” 6.8%. Total final demand is 9.6% per the press release.
Those stats quantify why it seems like grocery prices and other stuff in retail stores is more expensive that a few months ago and a lot more than a year ago.
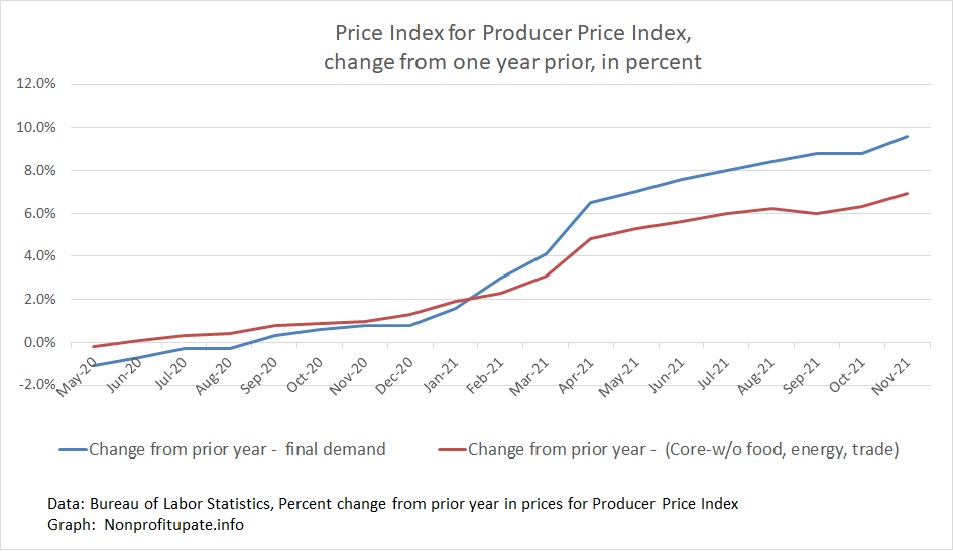
Severe increase every month of 2021 is accumulating into painful amounts. Check out the cumulative change in the PPI over the prior year:
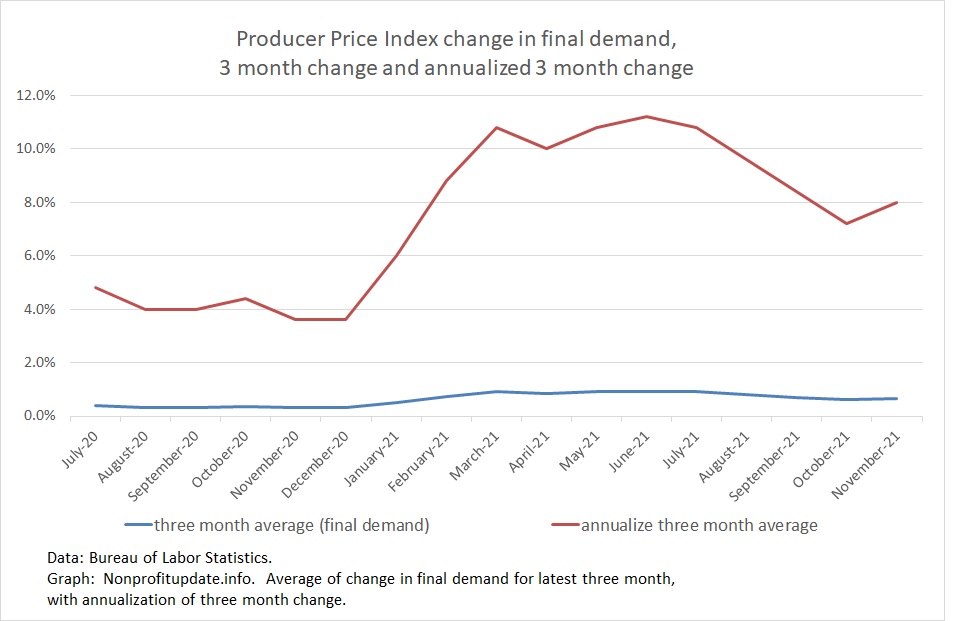
Just like during the Carter era inflation of sustained 1% per month price increases we now need to start annualizing and compounding inflation rates. Let’s see what it looks like if we annualize the PPI changes, shall we?
The following graph calculates an average of the most recent three-month change, which gives a rolling quarterly average. That amount is then annualized to see what the inflation rate would be if you continue for a year at the rate of inflation we suffered in the latest three months.
With this annualization of rolling three-month change, we see:
With amounts revised for recent months, we can see the year-over-year change is 9.6% in November. Year-over-year change has been above 6% since April 2021, over 8% since July, and is now approaching 10%.
The CPI is not revised. Both the PPI and PCE are adjusted based on updated information regarding prior months.
This index is explained by the Bureau of Labor Statistics as follows:
The Producer Price Index (PPI) is a family of indexes that measures the average change over time in selling prices received by domestic producers of goods and services. PPIs measure price change from the perspective of the seller. This contrasts with other measures, such as the Consumer Price Index (CPI), that measure price change from the purchaser’s perspective. Sellers’ and purchasers’ prices may differ due to government subsidies, sales and excise taxes, and distribution costs.
You can find the monthly announcement containing this information here.