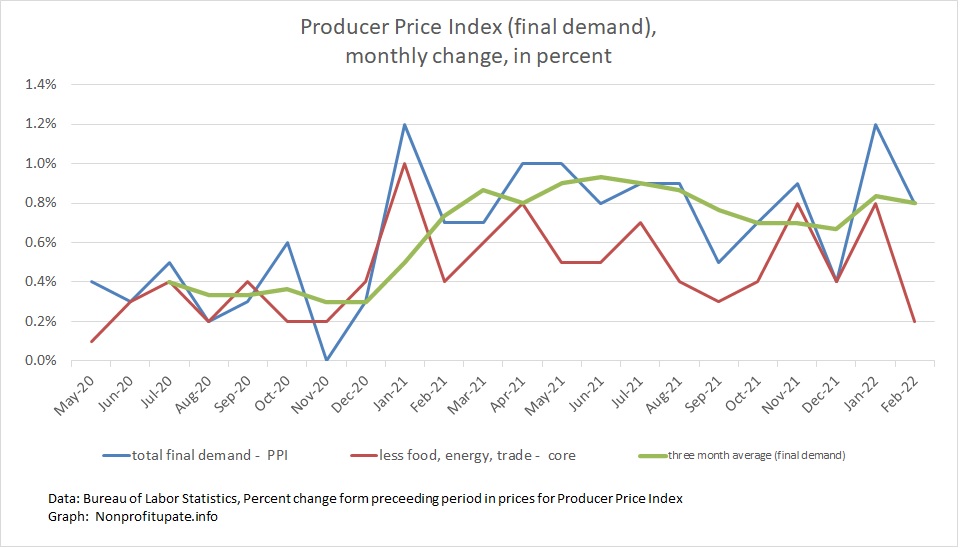
The Producer Price Index (PPI) rose 0.8% in February. The previously reported 1.0% rise in January was revised to 1.2%. So that is actually a cumulative increase of 1.0% in February
Keep in mind the prior monthly increases PPI are revised as needed. This is in contrast to CPI which is not revised.
In February, core PPI, without food, energy, & trade, was up 0.2% in February with January revised downward from 0.9% to 0.8%.
For background, the Bureau of Labor Statistics provides a description of PPI:
“The Producer Price Index (PPI) is a family of indexes that measures the average change over time in selling prices received by domestic producers of goods and services. PPIs measure price change from the perspective of the seller. This contrasts with other measures, such as the Consumer Price Index (CPI), that measure price change from the purchaser’s perspective. Sellers’ and purchasers’ prices may differ due to government subsidies, sales and excise taxes, and distribution costs.”
So the PPI measures prices received by producers for their goods and services. Those costs roll into the goods and services you and I buy as end consumers.
This means the increases in wholesale prices, which show a lot of inflation, are heading our way as those increases work themselves into the CPI.
Graph at the top of this post shows the monthly price change for total demand with separate line for total demand goods and total demand services.
With revisions, the year over year increase in PPI is 10.0% in February and January, which is only a slight increase from 9.9% in December and November and the increases were just under 9.0% for October back to August.
Take a look at the year over year change in final demand and core change which means without food, energy, and trade.

You can see a large increase starting in spring 2021, rising from 2% in January 2021 to around 5% or 7% in April. There has been a steady rise since then with main index over 8% since August. Allowing for a 0.1% rounding, the headline index has been 10% for the last four months.
Four months at 10%. Wow.
BLS breaks out the index between final demand for goods and final demand for services. Both have show inflation in the range of 1% per month for most of 2022 with slight reprieve of harsh increases during the fall.
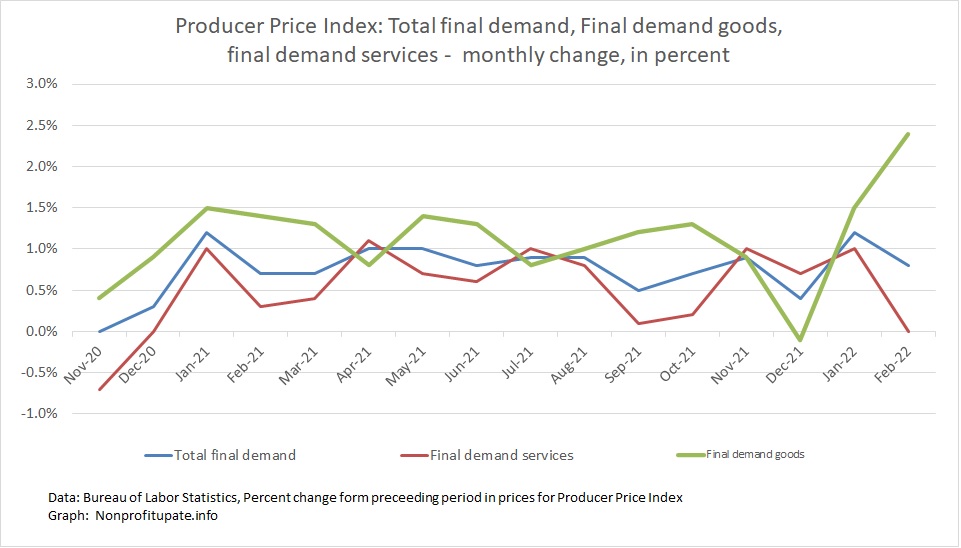
January showed around 1% for both goods and services. February is odd, with final demand goods up a whopping 2.4% for the month following 1.5% in January. Final demand services was flat (maintaining previous high prices, in other words) following 1.0% in January.
Thinking back to the inflation of the Carter era I am again pondering high inflation in terms of annualizing the monthly numbers. Following graph calcs a three-month average and then calculates an annualized rate. This smooths out the monthly flux. Here are the monthly PPI changes converted to three-month average, then annualized:

That shows a painful burst in the spring with many of the monthly calcs showing annualized 10% wholesale inflation. Rate was *merely* an annualized of 8% or 9% for fall of 2021 and is now back to around 10%.