Since my last post on 4/30/20, a month ago, there has finally been visible progress in the number of people losing their job.
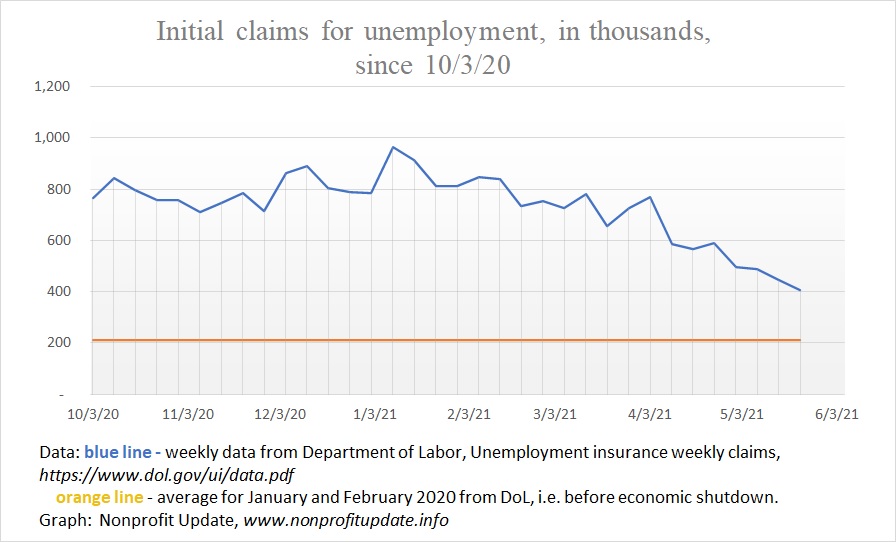
Since 4/24/21 the number of new claims for unemployment has dropped from 590,000 to 406,000 in the week ending 5/22/21. Graph above shows improvement. Average had been running around 800,000 from early October 2020 until late in February 2021.
The number of new claims is still double the average from before the pandemic. As recently as February it was four times, so that is progress. From quadruple for oh so many months to merely double is good. Not great for all those people losing their job now, but at overall level it is progress.
Purpose of these posts on economic statistics is to help all of us sort out what is going on in the overall economy.
Revised number of new claims in state programs over the last four months:
- 754K – 2/27/21
- 728K – 3/27/221
- 590K – 4/24/21
- 406K – 5/22/21
Following graphs show the ongoing human cost of the economic shutdown.
New claims
New claims for unemployment by week since the start of 2020:
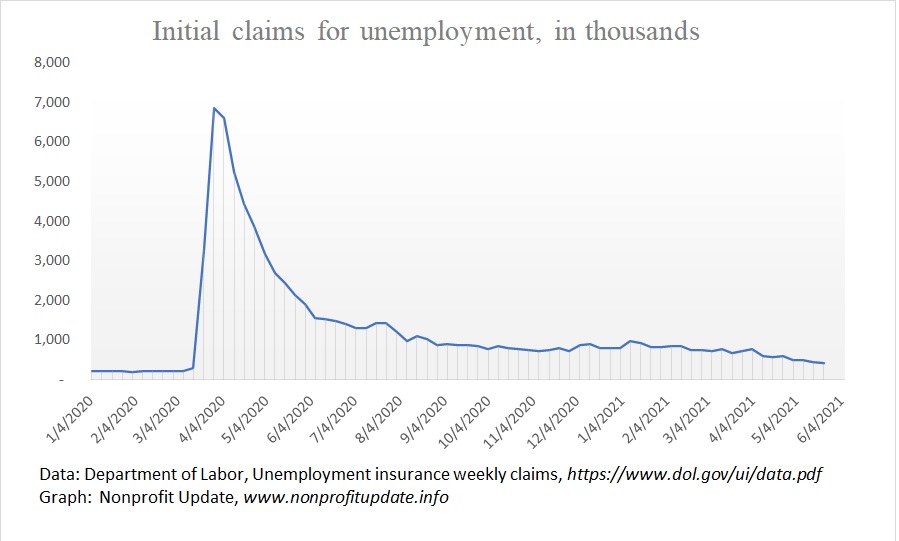
As mentioned above, the top of this post shows a graph looking closer at the new claims since 9/5/20.
Continuing claims
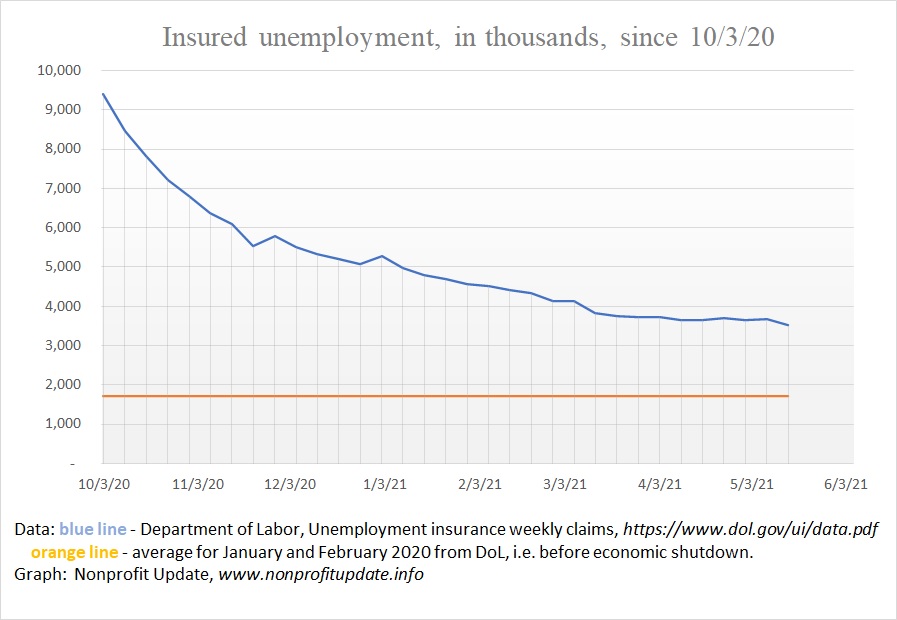
The number of people covered by unemployment insurance who are drawing checks is extremely high. The number has been declining. If you look at the following graph you can see the tally has been relatively flat since early March.
A huge portion of the drop in number of people drawing state unemployment has been offset by increase in number of people drawing extended benefits program at the federal level.
Continuing claims in state programs since start of 2020:
A closer look at the continuing claims at the state level only since 10/3/20. Notice the relatively flat line for quite a few weeks now and the distance between the last seven months and the normal claim levels before the shutdown:
Continuing claims in state and federal programs
When people exhaust their state level unemployment coverage, they become eligible for the extended federal benefits, called the Pandemic Emergency Unemployment Compensation program.
Tally of people who are now in the extended 13 weeks covered at the federal level is offsetting most of the drop in state-level programs. The number of total covered unemployed is dropping only slowly.
Looking at the following graph shows a relatively flat line since late October 2020. If you draw a line at the low points in the last seven months and a line at the high points you can visualize sort of a ‘trading range’, with fluctuations between 8.5M and 10.5M in the seven months since 11/7/20.
Graph of state coverage and extended federal coverage:
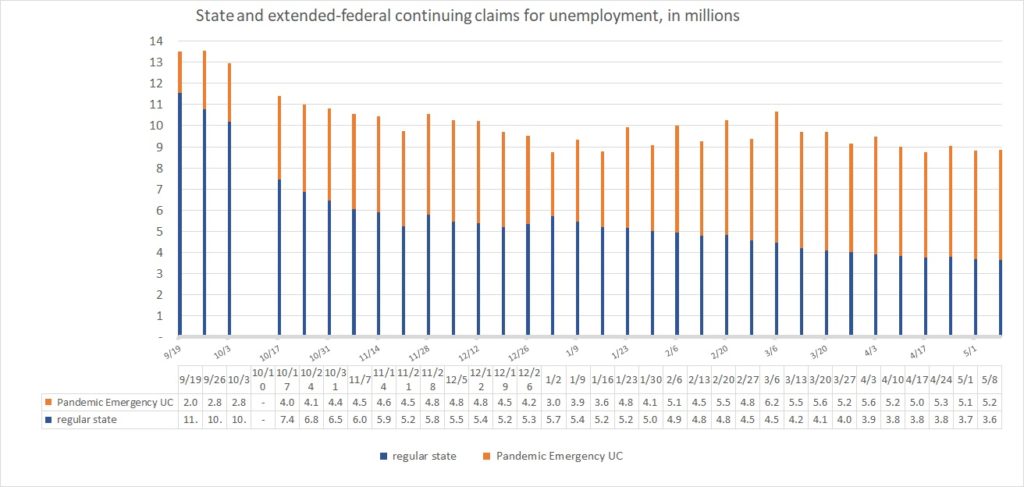
Roughly flat for seven months is grim.
To provide a clearer picture of the trend, let’s look at the combined federal and state ongoing claims in three week increments:
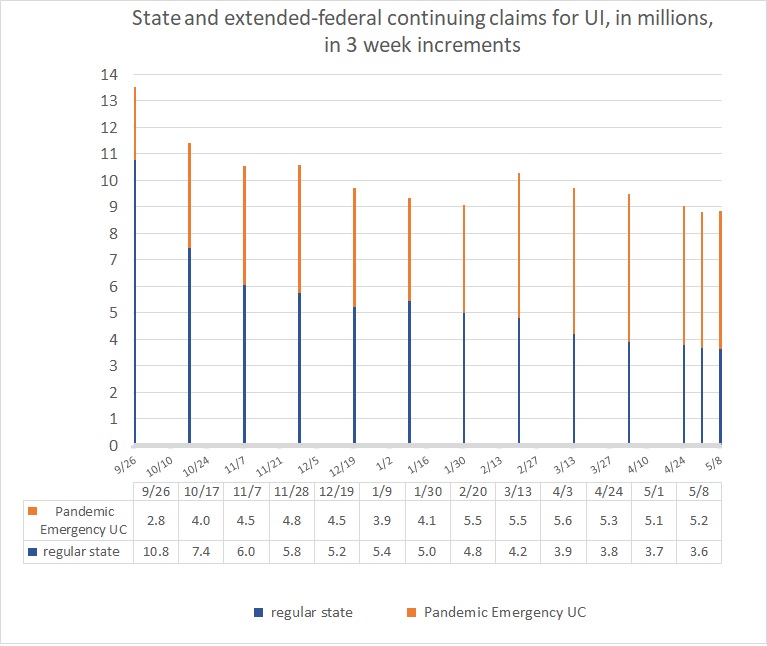
Looking at the three week increments shows slow improvement from 9/26/20 through 1/30/21, but generally flat since then. The number of people entering the federal program offsets the people exhausting their state-level benefits. Total unemployment tally kinda’ sorta’ looks like it has been stagnant for quite a few months.
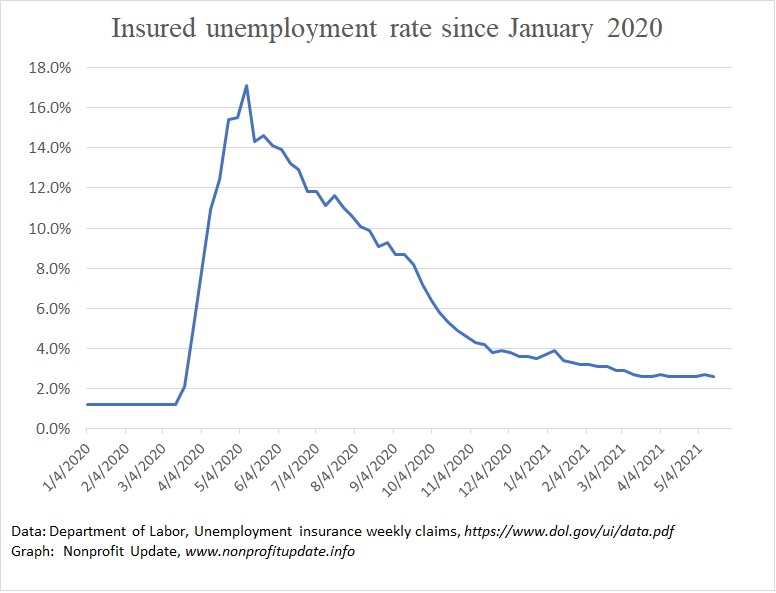
Insured unemployment rate
The proportion of people who are covered by unemployment insurance who are unemployed is also included in the weekly report. As you can see the insured unemployment rate has been dropping but looks to be rather flat.
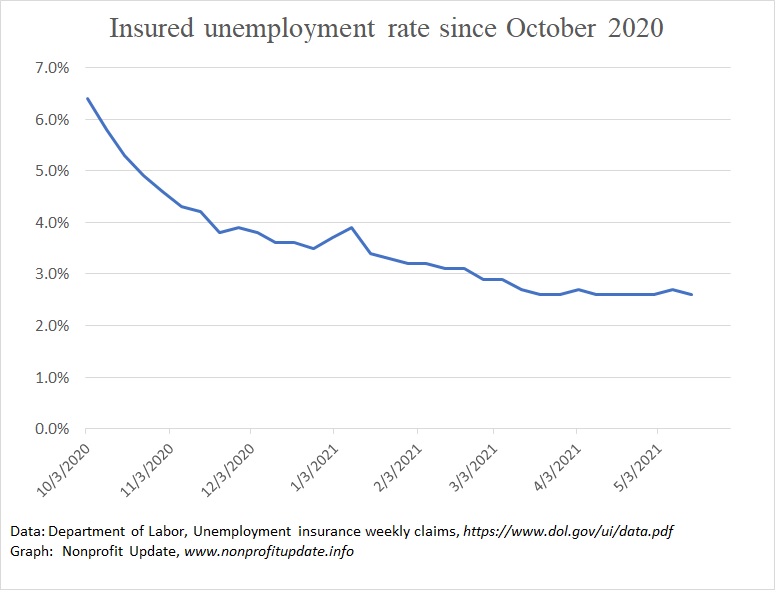
For a closer look, check out the insured unemployment rate since the start of October 2020:
Data source
Weekly press release from the Department of labor: Unemployment insurance weekly claims. At the end of the report you can find weekly data for this year. Page 4 has a table containing all the numbers I extracted for weekly update to these tables.