Everyone is aware of the Consumer Price Index. Another less known indicator of price levels is the Producer Price Index, or PPI.
The PPI suggests prices have been shooting up since the January 2021.
This index is explained by the Bureau of Labor Statistics:
The Producer Price Index (PPI) is a family of indexes that measures the average change over time in selling prices received by domestic producers of goods and services. PPIs measure price change from the perspective of the seller. This contrasts with other measures, such as the Consumer Price Index (CPI), that measure price change from the purchaser’s perspective. Sellers’ and purchasers’ prices may differ due to government subsidies, sales and excise taxes, and distribution costs.
https://www.bls.gov/ppi/overview.htm
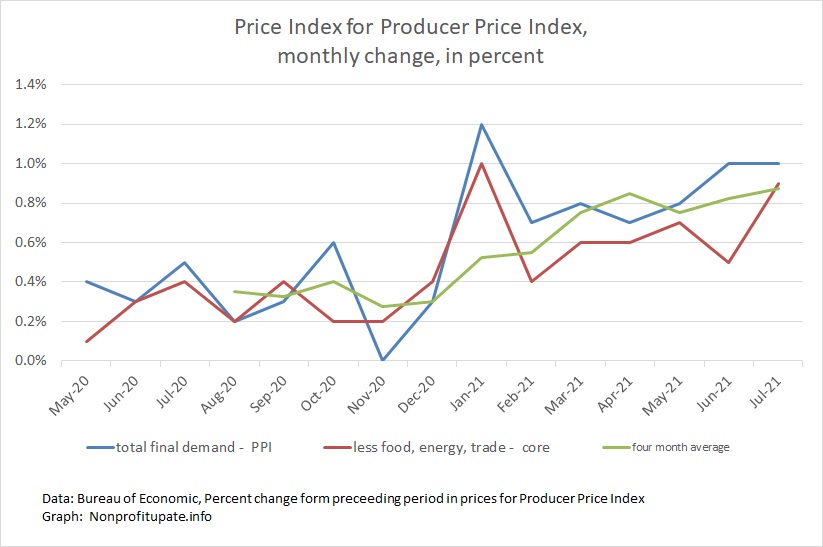
Graph at the top of this page for the PPI shows inflation was running in the range of 0.4% a month until the end of 2020. Check out the green line for a running four month average.
You can find the monthly announcement containing this information here.
Starting in January the increases have been running anywhere from 0.4% to 1.2%. For the last two months it has been 1.0%. The green line, again showing a four month trailing average, shows inflation has been running around 0.8% for the last five months.
For a really grim thought, analyze monthly rate for the last five months. Do the math and you will see an annualized inflation of between 9.6% up to 12%.
That is bad news, suggesting there will be a lot more increases in the CPI over the next few months.
The BLS calculates year-over-year changes in both the main index and a core index. Graphing their data shows:
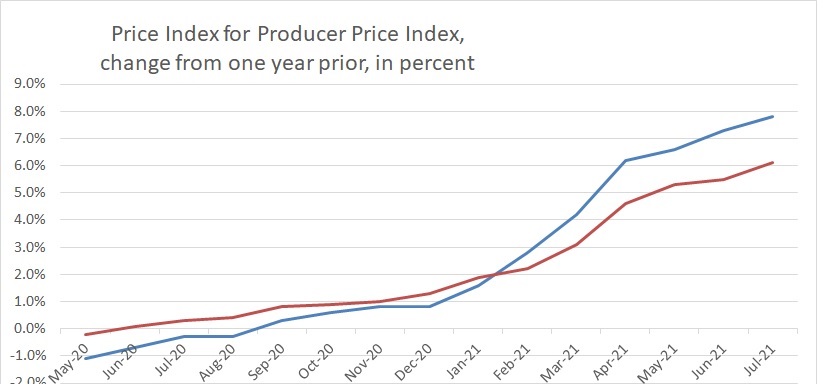
Year-over-year change shows a slow increase through about January 2021 with a rapid increase since then. Not good. Not good at all.