The Consumer Price Index, or CPI, shows 0.5% price increases in July with a core increase of 0.3%. While that is the lowest increase since February 2021, half a percent in one month works out to about 6% in a year.
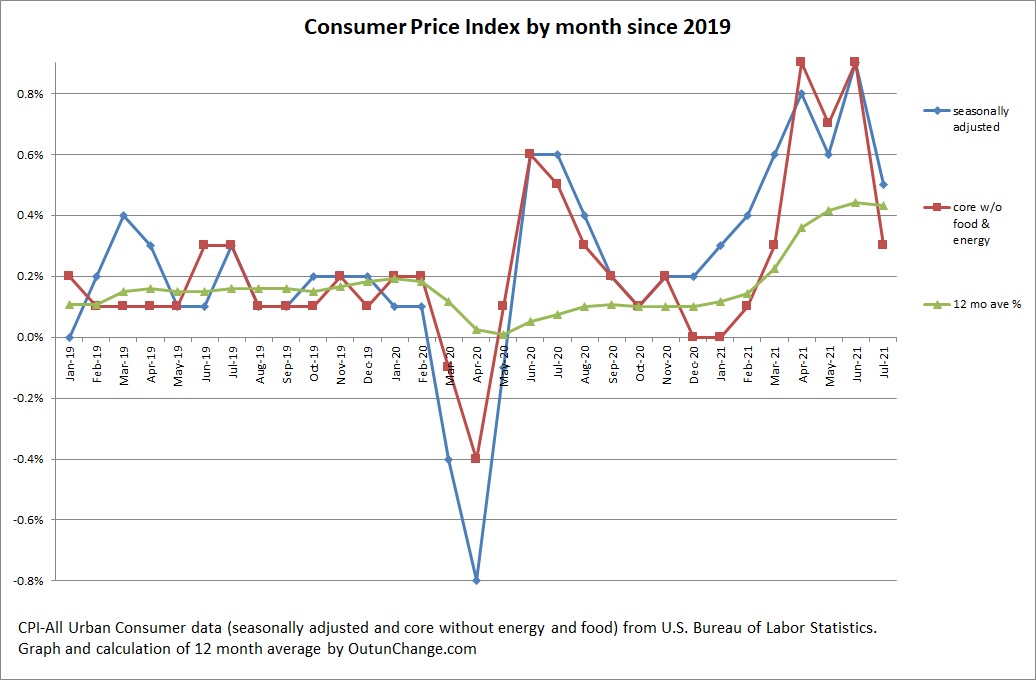
Graph at top of this post shows the monthly change in the primary index along with the core change which excludes food and energy. Graph also shows an average of the preceding 12 months.
The average was running around 0.1% a month for most of 2020 after the shock of the pandemic. You can see the rising monthly increase quite visibly, starting in January 2021. Watch the green line increase from around 0.1% up to currently 0.4%.
The trailing 12 month average is also grim. It shows:
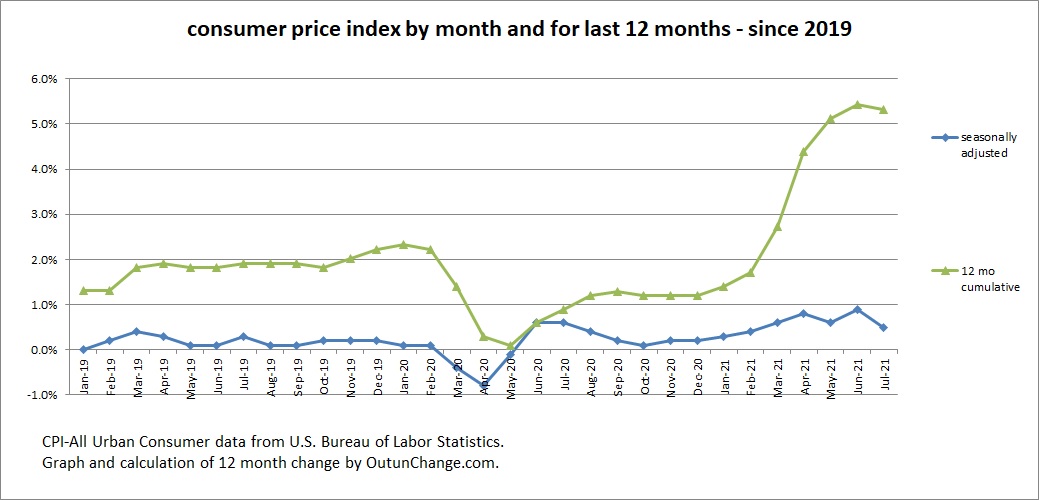
After the shock of April 2020 worked its way out of the 12 month change you can see the trailing average rapidly jumps to the 5% range.
For a number of months comments from the chairman of the Fed (Federal Reserve Board) claimed the increases were temporary and will shake out soon. Recent comments have indicated that, well, maybe there’s a teeny tiny bit more inflation than what the Fed thought, and it may possibly run longer than previous anticipated.
Ya’ think?
Since I am someone who remembers the horrors of Carter inflation (and also because I am an accountant) I constantly think in terms of annualizing the monthly inflation numbers.
Following graph shows my calculation of the monthly change in CPI, trailing three months average, and an annualization of the most recent three-month change.
What this tells us is how much prices have changed over the most recent three months and then what the annual inflation rate would be if the change in the last three months were to continue for a full year.
The results of annualizing the three month change:
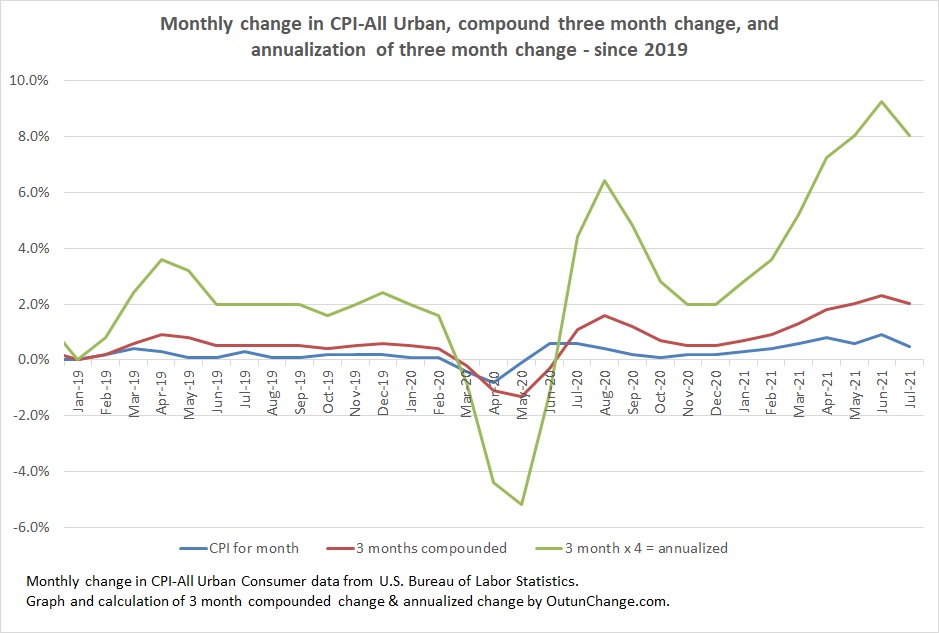
That hints we are running at anywhere from 7% to 9% annualized inflation. That is why 0.5% or 0.9% a month is so grim.