Got to wondering how much money the Fed has created out of thin air and then pumped into the economy. The answer is a vague “bunches and bunches.”
How do I know that? Because of my reading over the last few years. I pay attention to such stories (yeah, yeah, I know – I’m weird – pray for me as you feel led). I also am aware the Fed pumped a lot of money into the economy when the pandemic started.
There have been lots of news reports commenting they have been pumping something in the range of $100 billion a month into the economy after their initial round.
As I was thinking about things the federal, state, and local government have been doing to harm the economy, got to wondering just exactly how much fiat money the Fed has been creating, out of thin air of course. Yeah, I wonder about such things.
Answer is again bunches and bunches, and is measured in trillions of dollars.
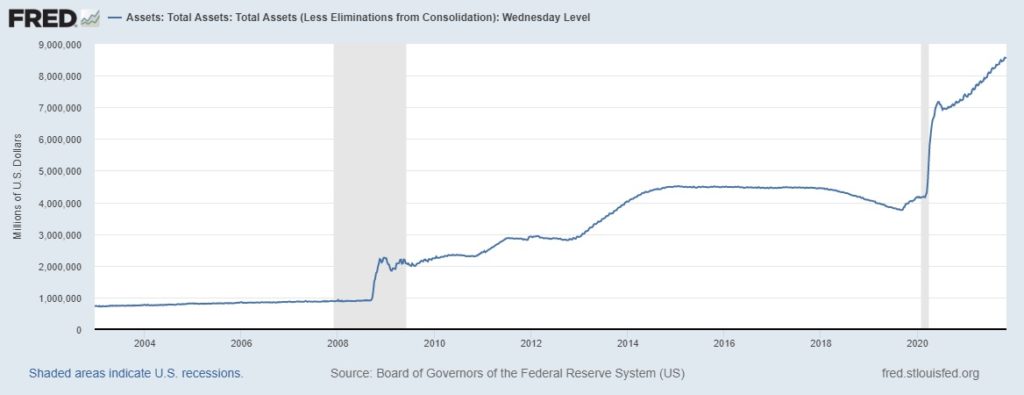
Graph above shows the amount of total assets on the Federal Reserves balance sheet since around 2003.
Wow.
A moment of background. One of the tools available to the Fed is buying and selling government securities. They don’t actually pay for what they buy. They go to the market, buy something, then ‘pay’ for it by recording a deposit into the account of whatever bank sold them the securities. That takes the treasury or agency security out of the market and puts cash onto the bank’s balance sheet, which they can in turn lend out or invest again.
The amount of open market transactions can be measured by looking at the total assets at the Fed. That is what the above graph and the following graph show.
You can access this data for yourself at FRED, a massive database maintained by the St. Louis Federal Reserve.
The amounts are measured in trillions of dollars.
Back in ancient times, by which I mean the Great Recession of 2008 and 2009, the Fed rapidly pumped a lot of money into the economy. Those of us who paid attention to this were shocked at the trillion dollars they pumped into the economy. This was necessary to prevent the liquidity crunch that was developing.
Unfortunately the Fed never sold those securities, but left that trillion dollars sloshing around in the economy.
Those days were teeny tiny small compared to what they have done since.
Let me put the story of the above graph into words.
In brief terms, Wikipedia summarizes as follows:
- First round of Quantitative Easing (QE1) was in November 2008 for about a trillion ($1T+).
- QE2 in November 2010 was another six hundred billion ($0.6T).
- QE3 in September 2012 was forty billion a month indefinitely, which was referred to as QE-infinity.
- QE4 starting in March 2020 was another seven hundred billion ($0.7T).
A longer description of the economy stimulating, inflation driving, money creation graphs presented in this discussion:
Back in 8/08, before the Great Recession the total assets were $0.91T (trillion). Because of liquidity needed for the Great Recession the total assets rose to $2.19T in 11/08.
Total assets increased to $2.87 in 7/11. The total assets stayed fairly level, sitting at $2.83T in 10/12.
Total assets increased another $1.7T, to $4.49T in 10/14. This stayed fairly level for the next several years.
Just before the pandemic took hold, on 2/19/20 the total assets were down a bit (if $300 billion can be called ‘a bit’) to $4.17T.
The radical expansion increased total assets to $7.16T on 6/10/20. That is just a smidgen under $3T increase in four months. (Please humor me by allowing $10 billion to be categorized as “a smidgen.”)
That is an extra $3 trillion, with a T, pumped into the economy in four months, all created out of thin air. No wonder the stock market went up dramatically last summer with that much of a sugar induced high.
Total assets dropped slightly to $6.92T on 7/8/20.
At that point the Fed started pumping about $100B or $150B into the economy ($0.1T-$0.15T if you want to keep the units consistent).
Those monthly increases pumped the total assets up to a $8.57T on 11/3/21. That is a $1.65T increase over the momentary low at 7/8/20.
So, that means the Fed created $3T in the immediate aftermath of the pandemic and another $1.7T in the last year and four months.
That is a fiat increase the money supply (created out of thin air) of about three trillion at the front end of the panic and another one and a half trillion after the initial explosion in the balance sheet.
Inflation
Just in case you are wondering about major causes of inflation we’ve seen in the last few months, the $4.4T radical growth in the Fed’s balance sheet is one of the major reasons. That is over four trillion dollars sloshing around a sluggish economy.
Go back to your undergrad economics class and recall the definition of inflation: Too much money chasing too few goods.
That’s too much money, in the amount of $4.4T, in an economy struggling to gear up production after a government ordered shutdown of said economy.
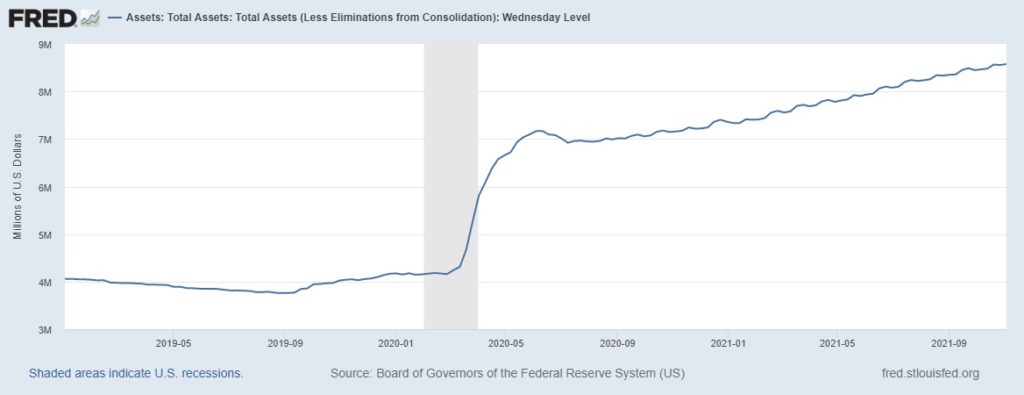
For a shorter term perspective, here is a graph of total assets since the start of 2019. Keep in mind the graph starts at 3 million million, or 3 trillion.

Raw data
In case you’re really, really interested, here is the raw data at the end of each month from January 2019 through this week. I downloaded the raw data, converted to trillions, and deleted everything except the last week in each month.
Resulting data is the trillions of dollars on the Fed’s balance sheet as of the last Wednesday of the month since January 2019.
| week | assets, $T | change, $T |
| 2019-01-02 | 4.06 | |
| 2019-01-30 | 4.04 | (0.02) |
| 2019-02-27 | 3.97 | (0.07) |
| 2019-03-27 | 3.96 | (0.02) |
| 2019-04-24 | 3.93 | (0.03) |
| 2019-05-29 | 3.85 | (0.08) |
| 2019-06-26 | 3.83 | (0.02) |
| 2019-07-31 | 3.78 | (0.05) |
| 2019-08-28 | 3.76 | (0.02) |
| 2019-09-25 | 3.86 | 0.10 |
| 2019-10-30 | 4.02 | 0.16 |
| 2019-11-27 | 4.05 | 0.03 |
| 2019-12-25 | 4.17 | 0.11 |
| 2020-01-29 | 4.15 | (0.01) |
| 2020-02-26 | 4.16 | 0.01 |
| 2020-03-25 | 5.25 | 1.10 |
| 2020-04-29 | 6.66 | 1.40 |
| 2020-05-27 | 7.10 | 0.44 |
| 2020-06-24 | 7.08 | (0.02) |
| 2020-07-29 | 6.95 | (0.13) |
| 2020-08-26 | 6.99 | 0.04 |
| 2020-09-30 | 7.06 | 0.07 |
| 2020-10-28 | 7.15 | 0.09 |
| 2020-11-25 | 7.22 | 0.07 |
| 2020-12-30 | 7.36 | 0.15 |
| 2021-01-27 | 7.40 | 0.04 |
| 2021-02-24 | 7.59 | 0.19 |
| 2021-03-31 | 7.69 | 0.10 |
| 2021-04-28 | 7.78 | 0.09 |
| 2021-05-26 | 7.90 | 0.12 |
| 2021-06-30 | 8.08 | 0.18 |
| 2021-07-28 | 8.22 | 0.14 |
| 2021-08-25 | 8.33 | 0.11 |
| 2021-09-29 | 8.45 | 0.12 |
| 2021-10-27 | 8.56 | 0.11 |
| 2021-11-03 | 8.57 | 0.02 |