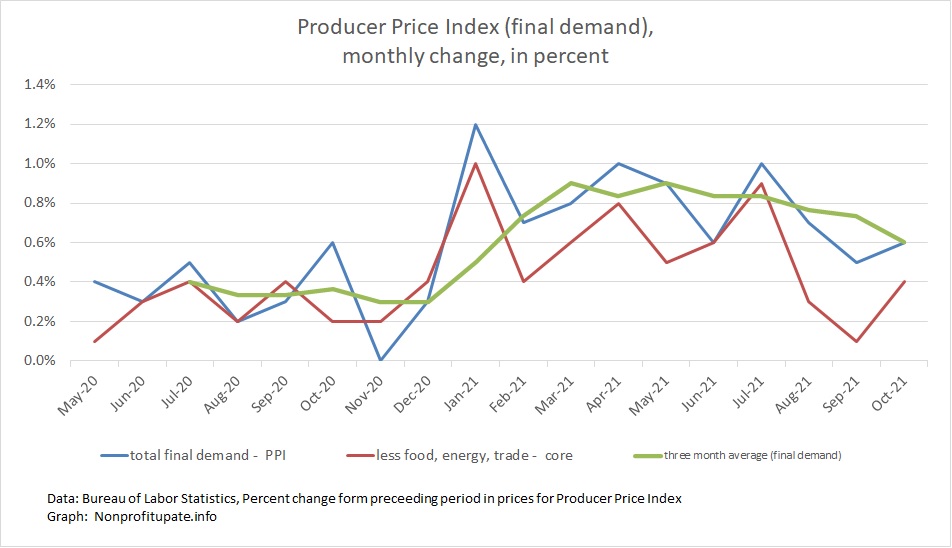
The Producer Price Index (PPI) in October 2021 continues to show unusually high and ongoing inflation. Increasing October was 0.6%, which follows a 0.5% increase in September and 0.7% increase in August.
The PPI has shown high inflation for all of 2021. The worst months were 1.2% in January, 1.0% in April, and 1.0% in July. Those extremes have not repeated for the last quarter, which is a small amount of good news.
Graph at the top of this post shows the monthly change and final demand (the total index in other words) in blue. The average of the monthly changes in green. The red line shows core change, which excludes food, energy, and trade.
The PPI was increasing around 0.4% the month until the end of 2020. Since then it has averaged 0.8% for 2021 through October. Ouch.
This index is explained by the Bureau of Labor Statistics as follows:
The Producer Price Index (PPI) is a family of indexes that measures the average change over time in selling prices received by domestic producers of goods and services. PPIs measure price change from the perspective of the seller. This contrasts with other measures, such as the Consumer Price Index (CPI), that measure price change from the purchaser’s perspective. Sellers’ and purchasers’ prices may differ due to government subsidies, sales and excise taxes, and distribution costs.
You can find the monthly announcement containing this information here.
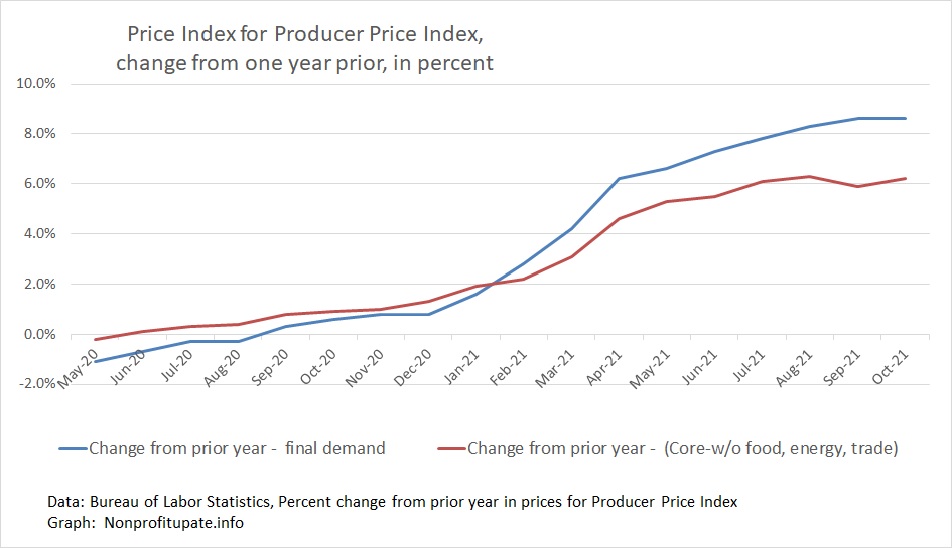
This many months of large increases is accumulating into unpleasant amounts. Check out the cumulative change in the PPI compared to the prior year:
Having experienced the Carter era inflation of sustained 1% per month price increases, I have memory of annualizing and compounding inflation rates. Let’s annualize the PPI changes, shall we?
The following graph is based on calculating an average of the most recent three-month change, which gives a rolling quarterly average. That amount is then annualized to see what the inflation rate would be if you continue for a year at the rate of the latest three months.
If we calculate this annualization of rolling three month change, we see:
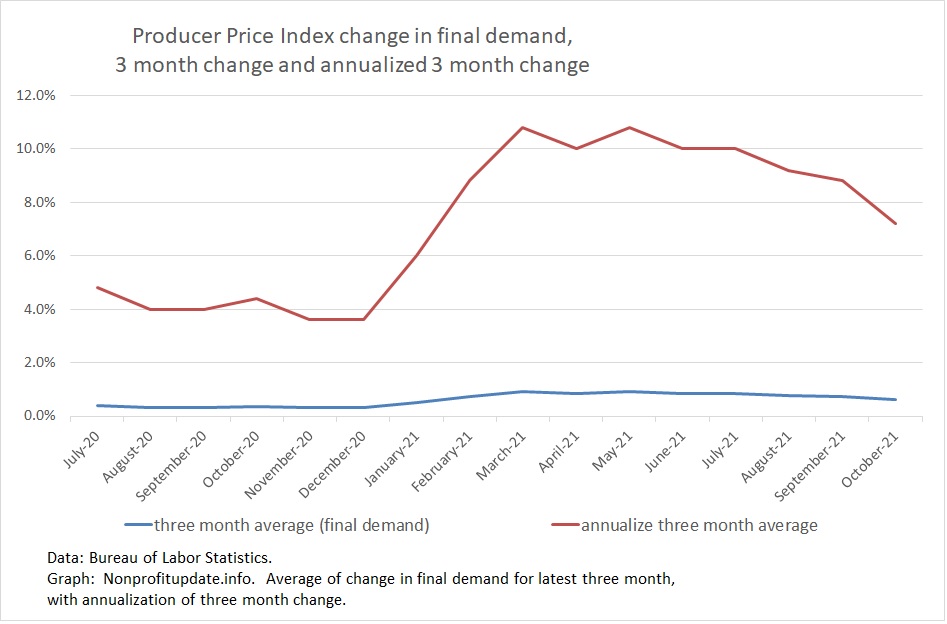
The decline from the 10% range is due to those two months of 1% increase now dropping out of the compounded change. With those gone, the annualized change is down to “only” 7.2% in October. This is better but still bad news for the economy overall.
It is also really bad news for you and me as consumers because those PPI increases will soon show up in the goods and services we buy.