Wow. Am I confused.
The number of people filing first-time claims for unemployment is now at the level before the pandemic started.
For the week ending 12/4/21 there were 184,000 new claims. The four-week average is 219,000 which is almost a match to the average of 212,000 average in January and February 2020.
The number of people drawing unemployment insurance is 1.99 million which shows a continual decline and is approaching the 1.72 million average before the pandemic.
Yet the civilian labor force is still 2 million below the start of the pandemic and the number of people not in the labor force is 5 million higher. Everywhere you look you see help wanted signs and in my tiny corner of the world I have seen restaurants cutting back service or closing in the middle of the workday. Everywhere you look you read about a massive shortage of staff.
Part of the explanation for this confusing picture is common to read about the surprisingly low number of new claims. Speculation in several articles I read is this reflects employers being very hesitant to let go of workers if they think they will be unable to find new staff if needed in the near-term.
For example, consider this report:
Wall Street Journal – 11/9/21 – US Jobless Claims Fall to Lowest Level and 52 Years – Without attribution, article says that drop of new claims is because employers hesitant to let people go because there is a small pool of new staff, there are already lots of open jobs, and consumer demand continues strong.
More indications of the tension I mentioned in the articles that there’s 11 million open jobs in October in contrast to 7.4 million people unemployed. That points to a roughly 3.5 million gap.
Article says employers are offering higher wages to draw in staff where they need more help.
So you can see why I continue to write about economic statistics. I’m guessing you are also wondering what is going on. Here are some numbers and graphs on the unemployment situation.
A recap of new claims for unemployment over the last several months:
- 371K – 6/26/21
- 387K – 7/31/21
- 345K – 8/28/21
- 364K – 9/25/21
- 271K – 10/30/21 – noticeable improvement
- 194K – 11/20/21 – first time new claims were below the average in January February 2020
- 227K – 11/27/21
- 184K – 12/4/21
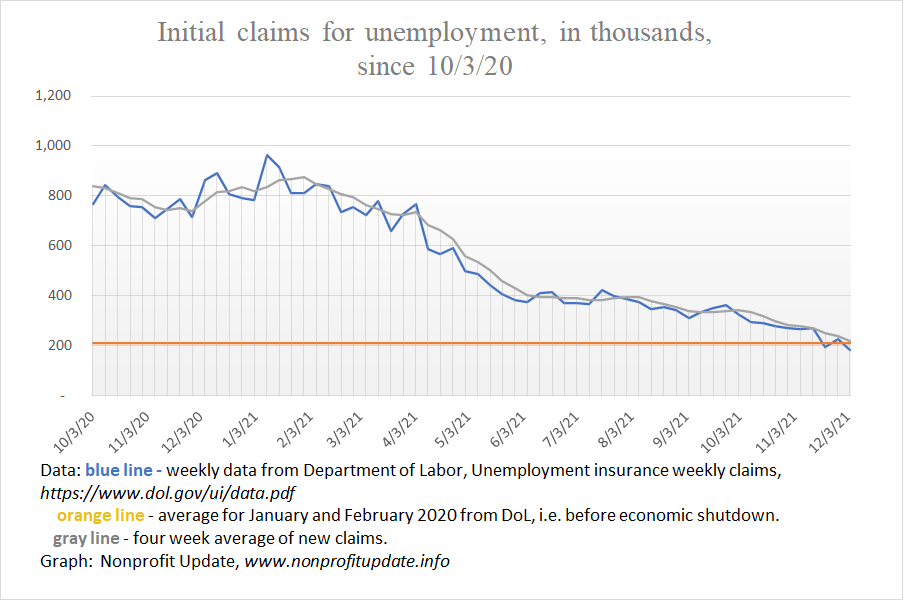
Graph at the top of this post shows the number of new claims for unemployment since the start of October 2020.
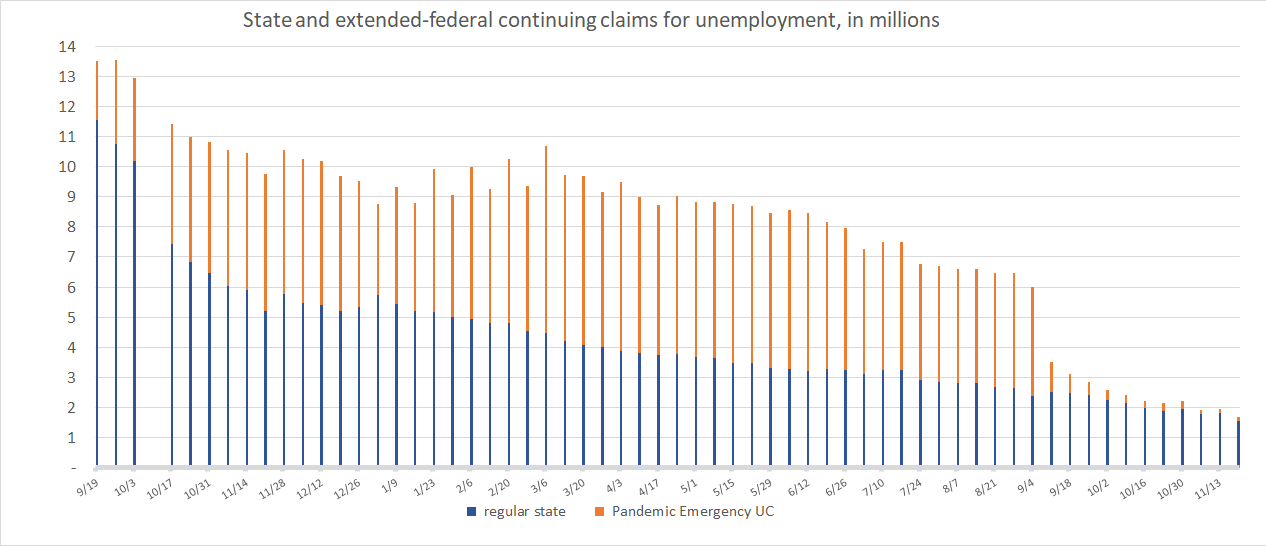
Continuing claims
A drop in the number of unemployed covered in state programs was offset by increases in number of people drawing extended benefits at the federal level.
The federal program ended at the end of August. The number of people in the program dropped dramatically in the week ended 9/11/21 and has continued to drop.
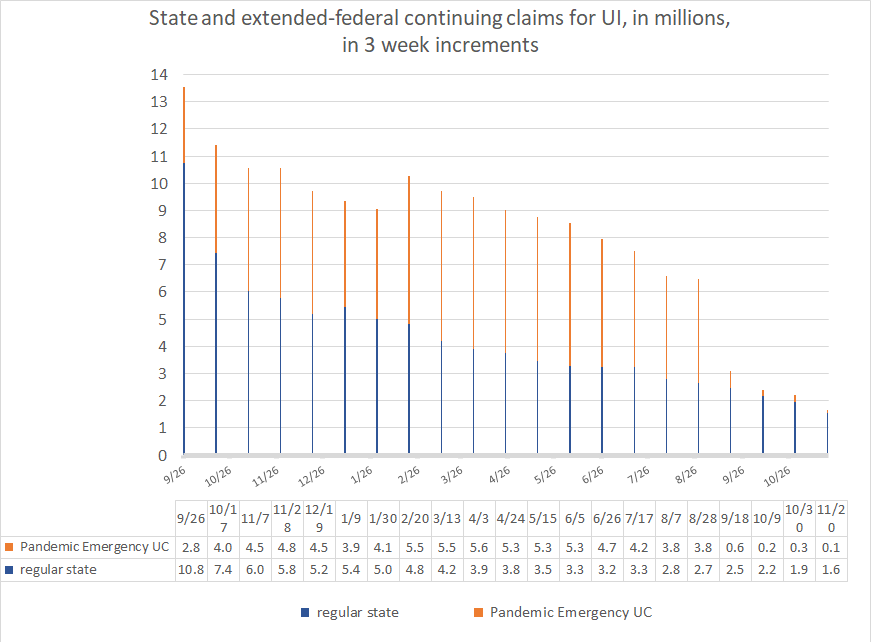
Here is a weekly tally of people drawing unemployment in the state and extended-federal unemployment programs. Notice the visible drop in the federal program in September and October 2021.
To simplify and smooth out the data, take a look at the federal and state unemployment coverage in three-week increments. For your consideration: