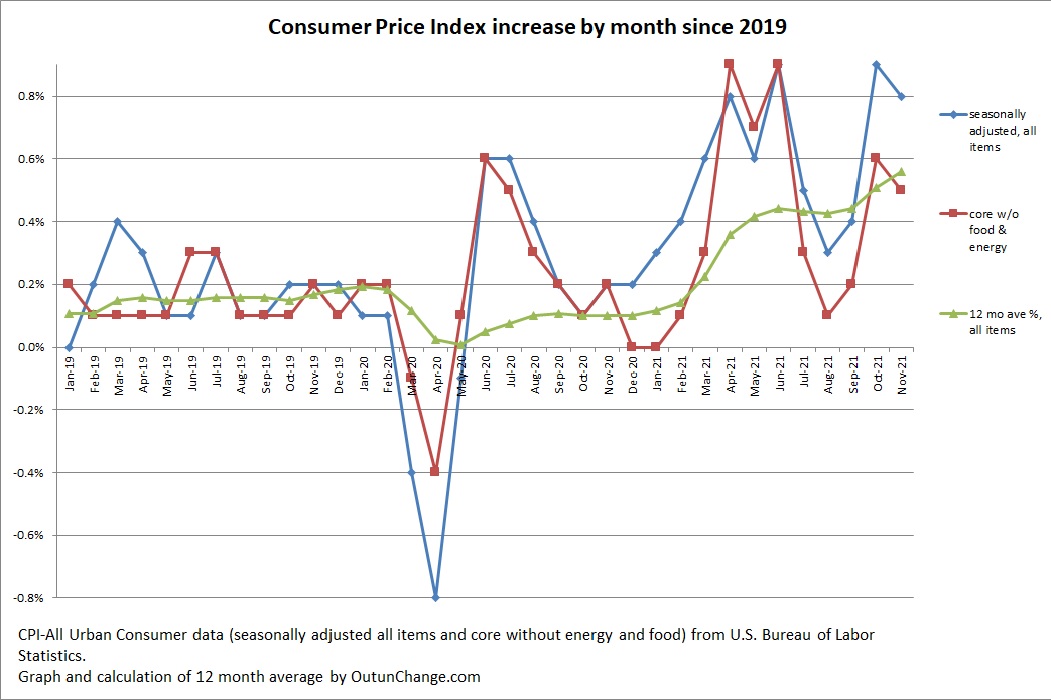
The Consumer Price Index (CPI) increased 0.8% in November after a 0.9% increase in prior month.
That is 2.1% for the last three months, which would be about 8.4% if the increase in the last three months continued for a year.
Graph at top of this post shows the monthly increase in the all-items index along with the core change, which excludes food and energy. Graph also shows an average of the preceding 12 months for the all-items indicator.
The 12 month cumulative change is distressing. The monthly change in all items index and the cumulative change for 12 months looks as follows:
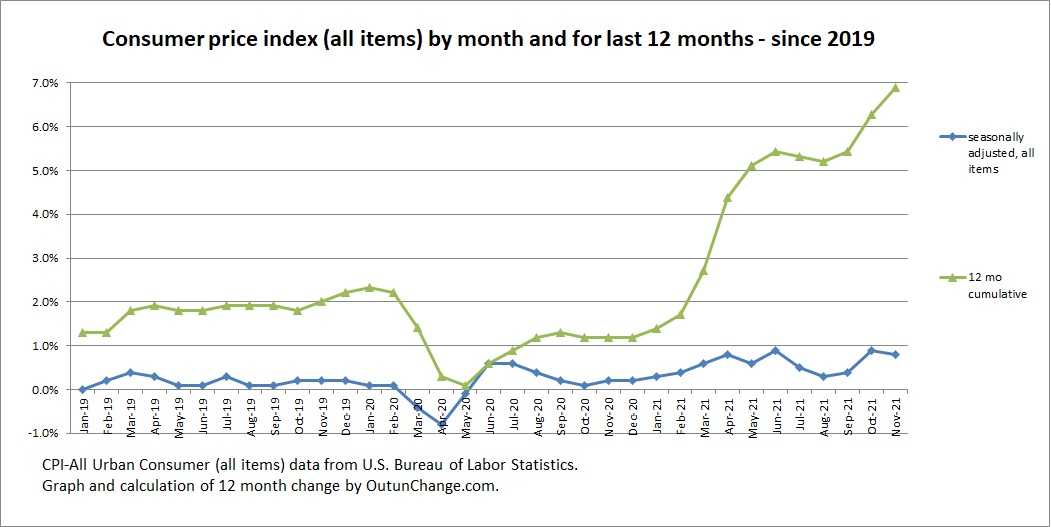
You can see a breakout in inflation rate in spring 2021. The 12-month change had been running around 2% before the pandemic. For the last eight months the 12-month change in CPI has been over 4%. For the last two months the year-over-year change is over 6%.
Let’s look at what inflation rate would be if it continued for a year at the monthly change. In other words, let’s annualize the monthly increases.
Following graph shows my calculation of the monthly change in CPI, trailing three-month average, and an annualization of the most recent three-month change.
The results of annualizing the three-month change:
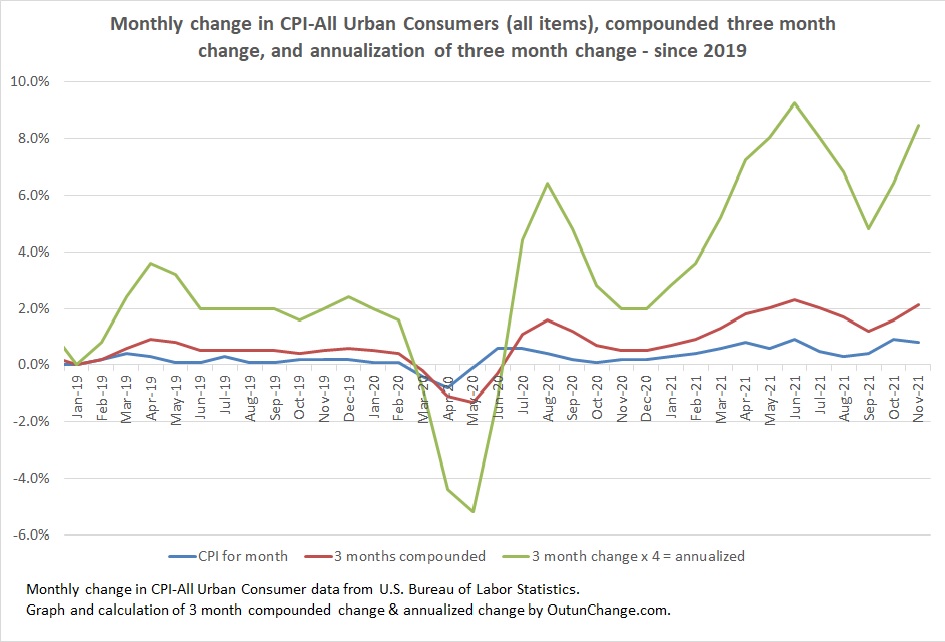
Smooth out the curve and it looks like we suffering an inflation rate over 7%.