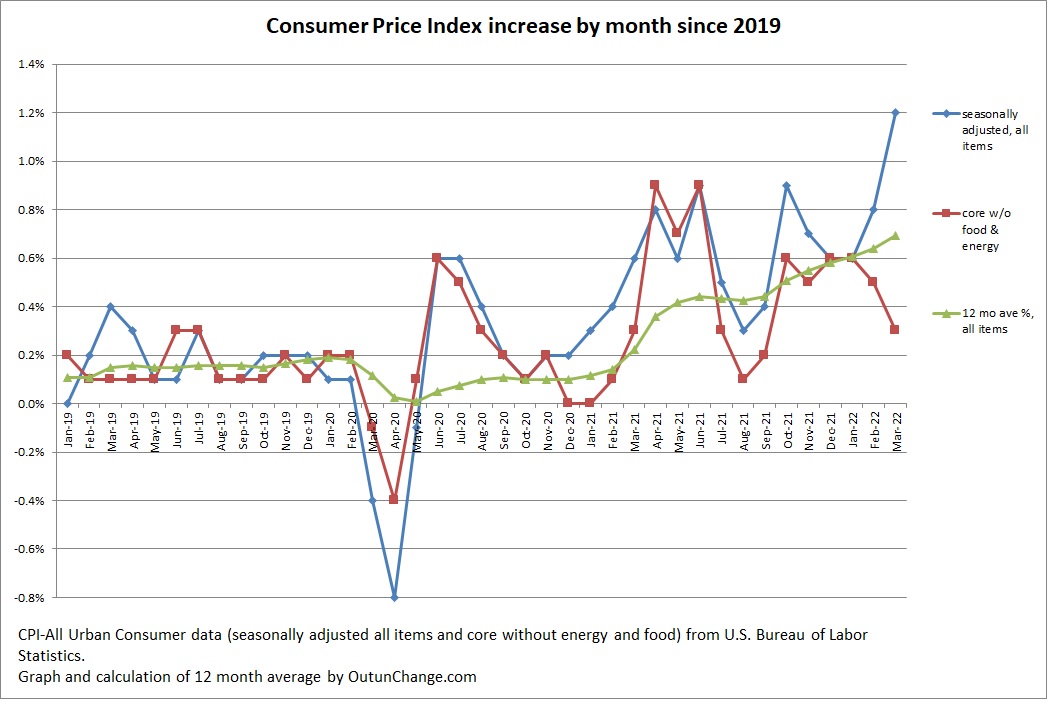
The Consumer Price Index (CPI) increased a staggering 1.2% in March 2022 after 0.8% in February
That is 2.6% for the last three months. Project three months out to a full year would be 10.4%
Graph at top of this post shows the monthly increase in the all-items index along with the core change, which excludes food and energy. Graph also shows an average of the preceding 12 months for the all-items indicator.
By the way, with the CPI accelerating the top number in all of these graphs had to be increased. That is the result of high inflation that is accelerating,
The 12 month cumulative change continues to skyrocket. The monthly change in all items index and the cumulative change for 12 months looks as follows:
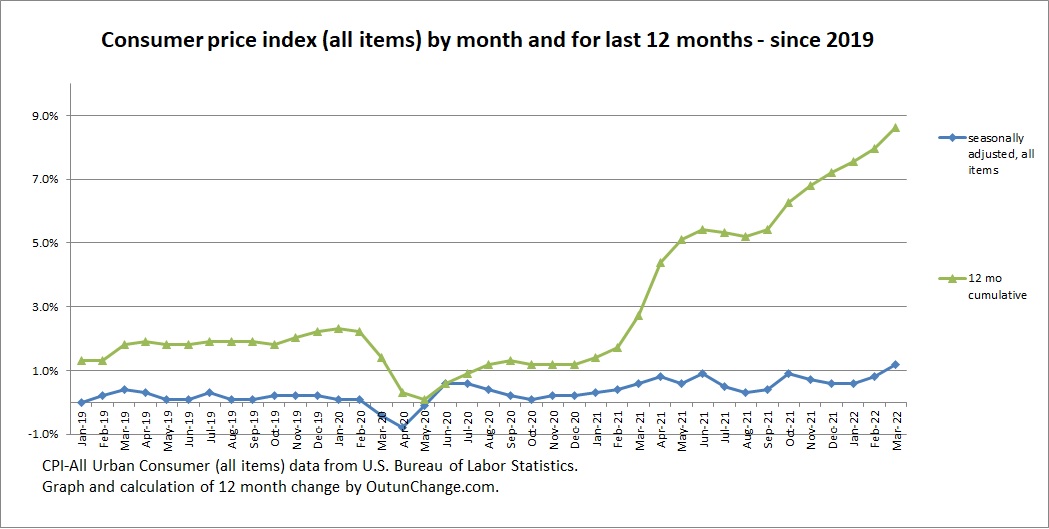
BLS calculates the year-over-year at 8.5%. Compounding the monthly rate actuals shows 8.62%. The BLS announcement reports this is the highest increase in the year-over-year rate since December 1981. Highest in 40 years and three months.
Look at the chart again and there is a visible breakout of inflation back in spring 2021. The 12-month change had been running around 2% before the pandemic. The 12-month change has been soaring since then.
Let’s look at the monthly CPI change and year-over-year for preceding 12 months. Check it out:
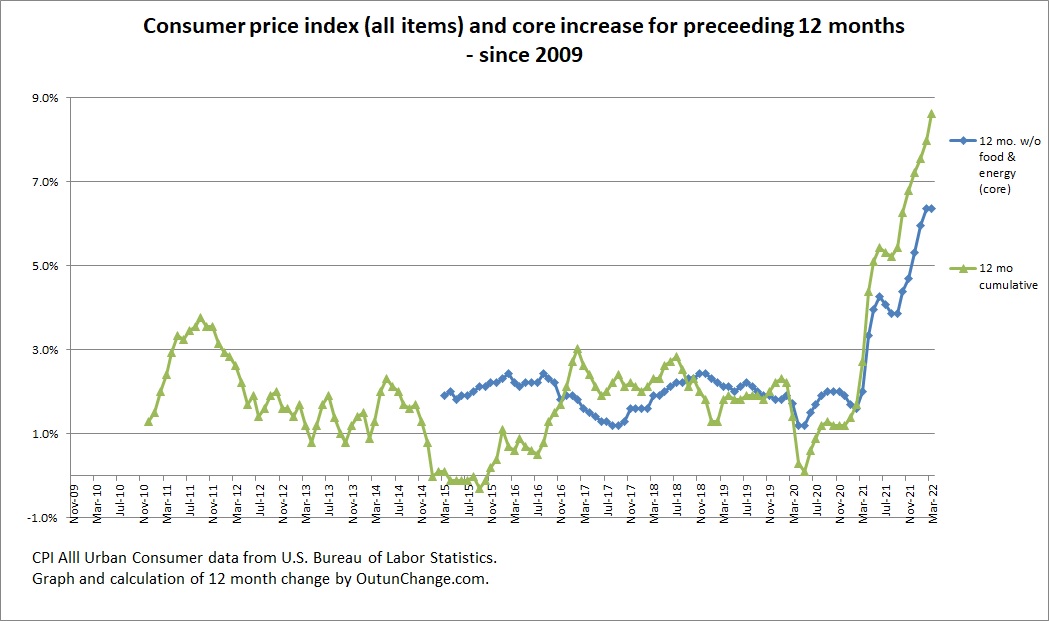
From around 2010 through 2014 you can see was running around 2% with a peek at just under 4% in mid-2011. Near zero inflation was seen for most of 2015, then rising back to the roughly 2% range until the pandemic.
The longer-term graph highlights the surging inflation in 2021 continuing into 2022.
Let’s look at what inflation rate would be if it continued for a year at the monthly change. In other words, let’s annualize the monthly increases.
Following graph shows my calculation of the monthly change in CPI, trailing three-month average, and an annualization of the most recent three-month change. This calculation smooths out the monthly variation while allowing us to see the overall trend if it were to continue for a year.
The results of annualizing the three-month change:
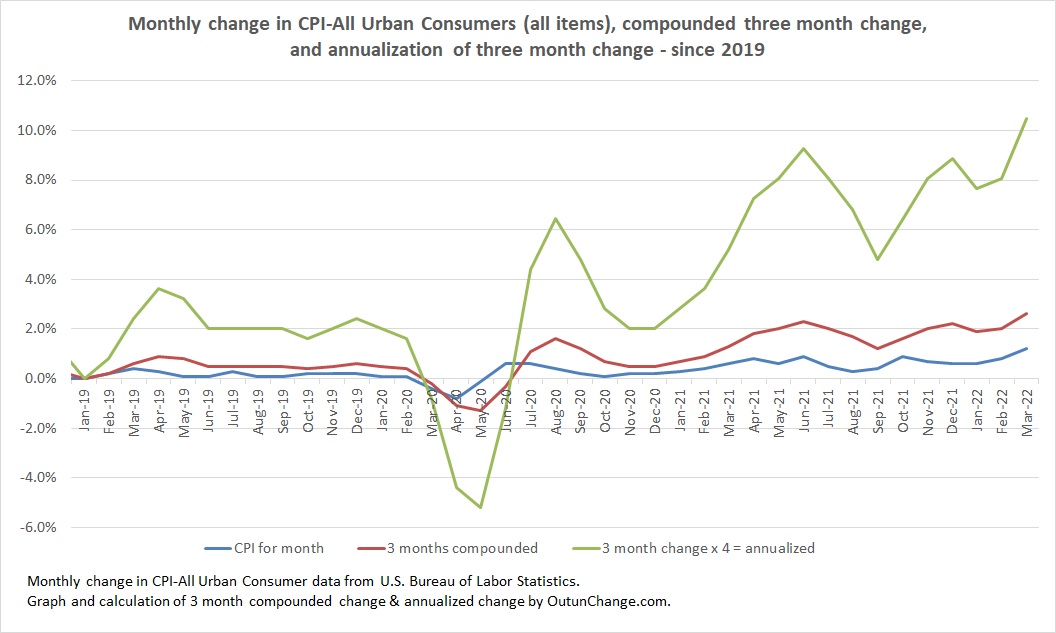
Smooth out the curve and it looks like we have a smooth line up which has broken through the 10% range.