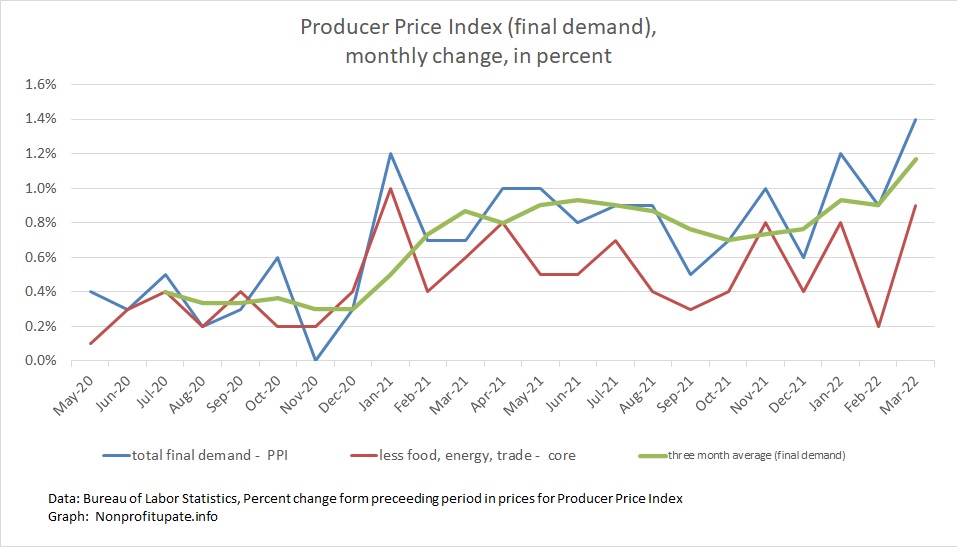
The Producer Price Index (PPI) rose 1.4% in March 2022. This follows the February increase revised up by 0.1% to 0.9%. The January increase was previously revised up by 0.2% to 1.2%.
That is 3.5% in the first quarter of 2022.
The increases are driven by strong consumer demand and constrained supply.
Powerful demand is compounded by trillions of dollars having been flooded into the economy. On the supply side, ongoing supply chain problems are compounded by things like shutting down Shanghai, a city of 27 million which takes off line all their production and stops shipping from a major port. Further restricting the supply side are also soaring energy prices due to U.S. federal policies and the war in Ukraine.
Keep in mind the prior month changes in PPI are revised as needed. This is in contrast to CPI, which is not revised.
This shows there are plenty of increases in wholesale prices, which means there is a lot of inflation heading our way because that is what producers and providers are experiencing. Those increases will hit us consumers soon.
Graph at the top of this post shows the monthly price change for total demand, final demand core (which excludes food, energy, and trade), along with three month average of the final demand.
With revisions, the year over year increase in PPI for recent months is:
- 9.9% – November 2021
- 10.0% – December
- 10.0% – January 2022
- 10.3% – February
- 11.2% – March
Those are painful numbers and the direction is worrisome as well: high and accelerating is not good.
Here is the year over year change in final demand and core change in graph form:
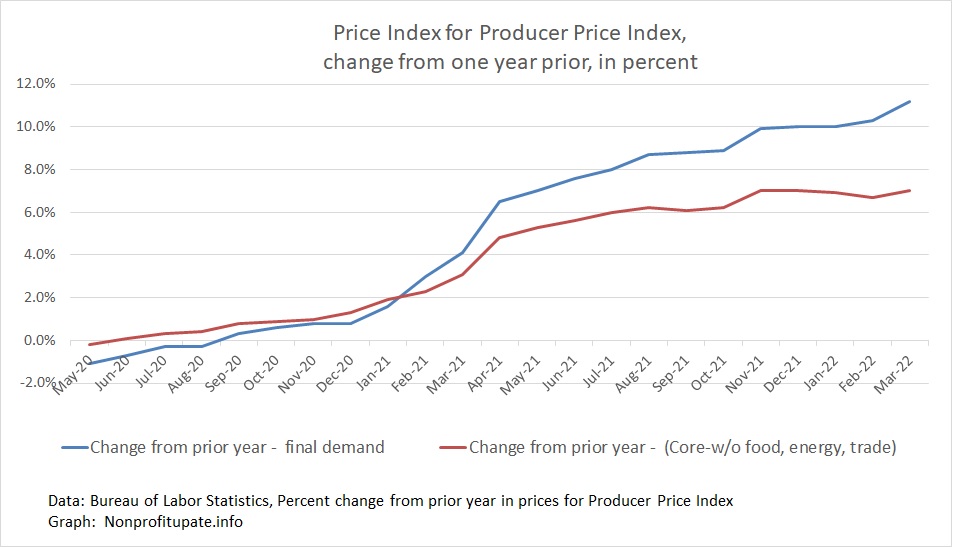
You can see acceleration in prices staring in spring 2021, with rising prices going from 2% in January 2021 to around 5% or 7% in spring, with continuing rise now at 10% and still rising.
BLS breaks out the index between final demand for goods and final demand for services.
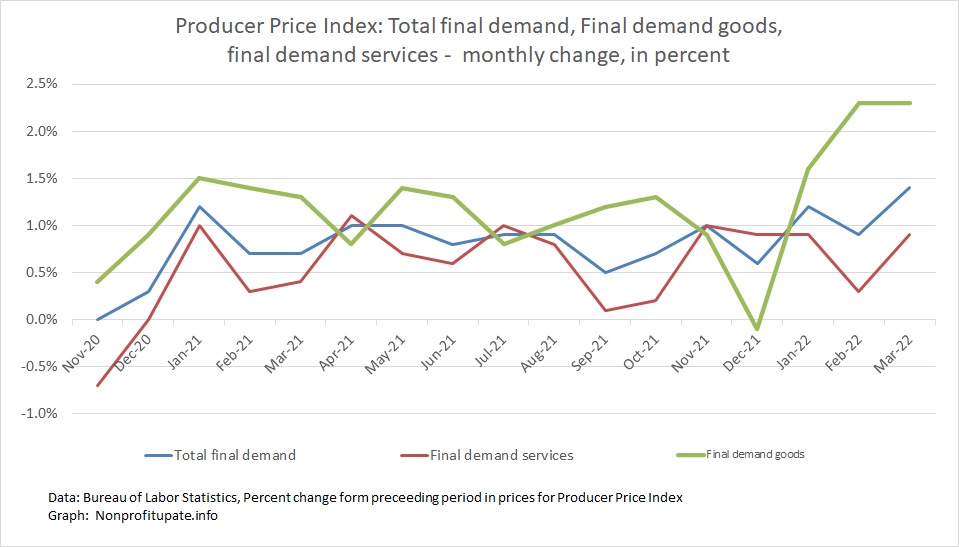
Final demand goods index has been soaring at over 2% for two months in a row. Final demand services is sitting at merely 1% a month. If you don’t grasp the danger, consider that if those increases continued for a year it would be 12% for services and 24% for goods.
For many months I have been annualizing the change for the last three months. This is a painful lesson learned from having lived through Carter Era inflation.
Following calcs look at a three-month average and then calculates an annualized rate. This smooths out the monthly flux and considers what inflation would be if it continued for a year at the rate of increase over the latest three months.
Let’s look at the monthly PPI changes converted to three-month average, then annualized:
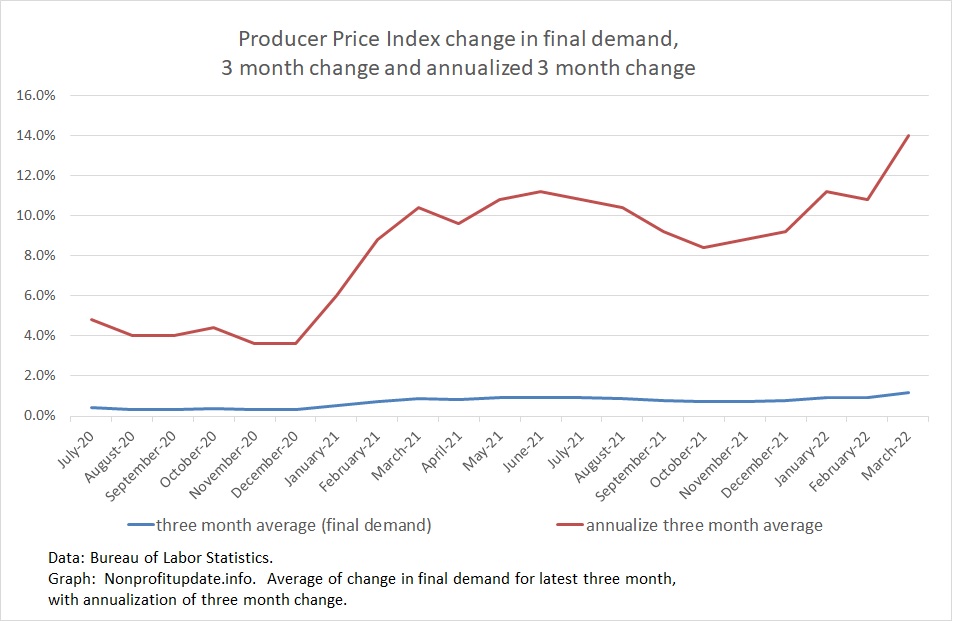
That shows a painful burst in the spring of 2021 to the roughly 10% range.
There is another burst to 11% in January and February 2022 with an annualized rise of 14% in March.
That is rather unsettling for us consumers since it is one measure of increases we may be seeing in the near future.
For background, the Bureau of Labor Statistics provides a description of PPI:
“The Producer Price Index (PPI) is a family of indexes that measures the average change over time in selling prices received by domestic producers of goods and services. PPIs measure price change from the perspective of the seller. This contrasts with other measures, such as the Consumer Price Index (CPI), that measure price change from the purchaser’s perspective. Sellers’ and purchasers’ prices may differ due to government subsidies, sales and excise taxes, and distribution costs.”
So the PPI measures prices received by producers for their goods and services. Those costs work their way into the goods and services you and I buy as end consumers.