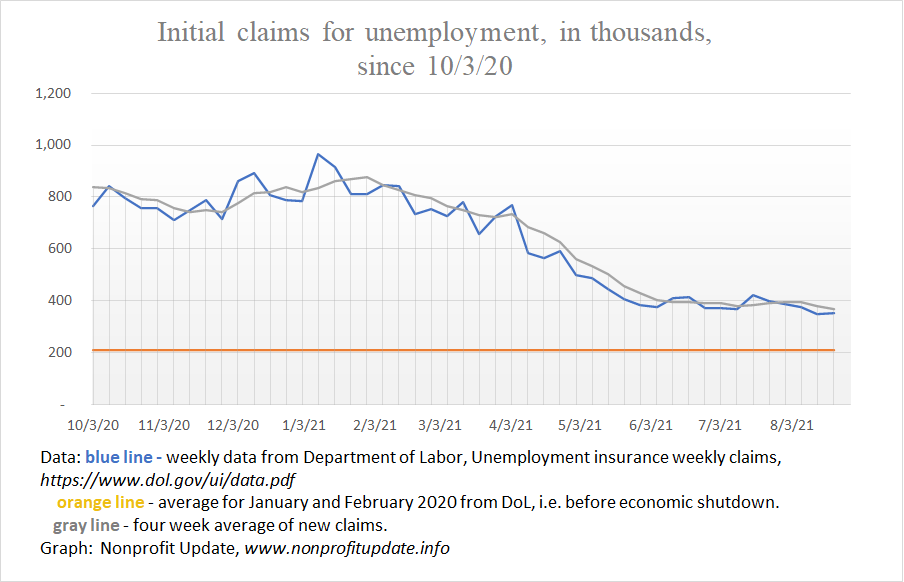
New claims for unemployment are down about 60,000 per week since my last post 10 weeks ago. For the week ending 8/21/21 new claims were 353K compared to 412K the week of 6/12/21.
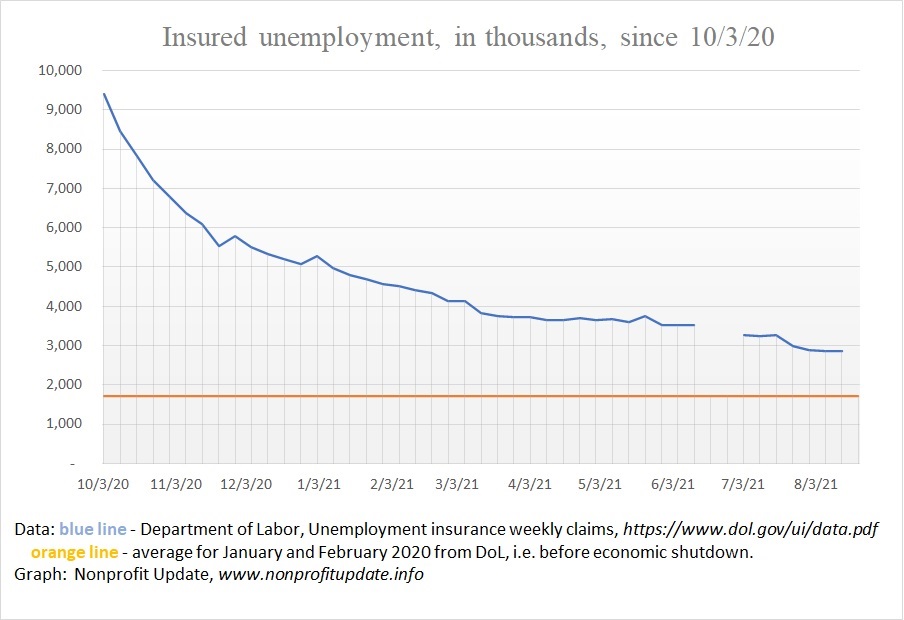
The number of insured unemployed has dropped more substantially, from 3.53M the week ending 6/12/21 to 2.9M the week ending 8/14/21. That is a drop of 672K over nine weeks. For contrast the number of insured unemployed was averaging 1.7M in January and February 2020.
Those numbers reveal a slow improvement although the number of people losing their jobs each week is still running double the average in January and February 2020.
Purpose of these posts on economic statistics is to help all of us keep current on what is going on in the overall economy.
What I’m drawing from the data is the economy is improving one little bit at a time. Seems to me the recovery is slowing.
Revised number of weekly new claims in state programs over recent months shows following trend:
- 406K – 5/22/21
- 412K – 6/12/21
- 368K – 7/10/21
- 349K – 8/14/21
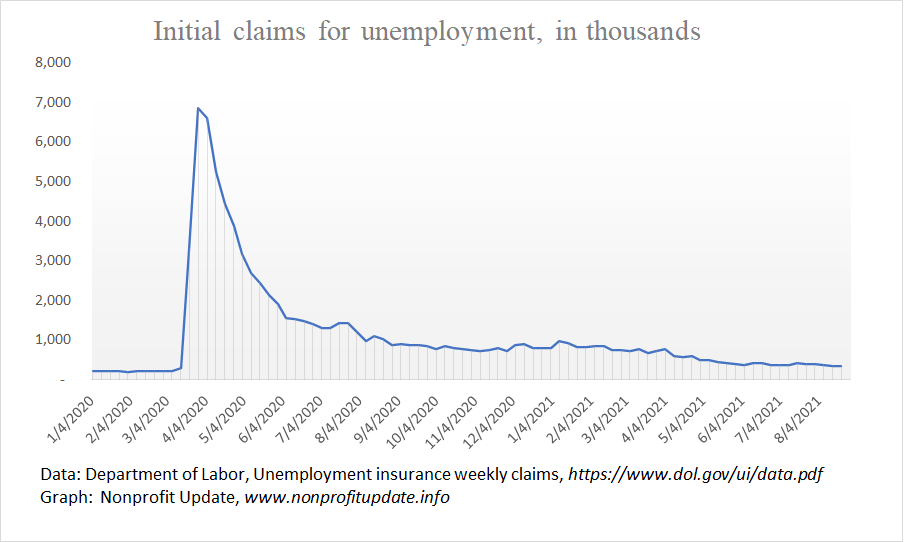
Following graphs show the devastation from the economic shutdown.
New claims
New claims for unemployment by week since the start of 2020:
As mentioned above, the top of this post shows a graph looking closer at the new claims since 9/5/20.
Continuing claims
The number of people covered by unemployment insurance at the state level who are drawing checks continues to be high compared to historical averages. The number has continued to decline. However if you look at the following graph the changes been very small since early March. A huge portion of the drop in the number of unemployed covered in state programs has been offset substantially by increase in number of people drawing extended benefits at the federal level.
Let’s take a closer look at the continuing claims at the state level only since 10/3/20. Notice the relatively flat line for quite a few weeks now. There is still quite a distance between the last several months and the normal claim levels before the shutdown:
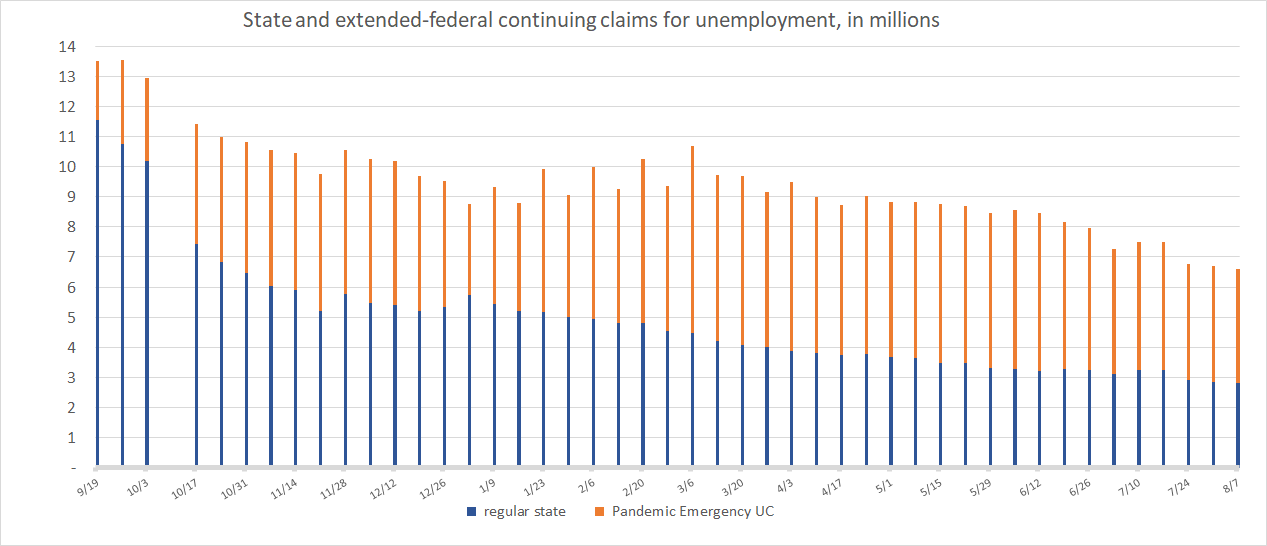
Continuing claims in state and federal programs
When people exhaust their state level unemployment coverage, they become eligible for the extended federal benefits, called the Pandemic Emergency Unemployment Compensation program.
For a long time the count of people who left the state-level programs was more than offset by increases in the people covered by the extended 13 weeks in the federal program. Then for a couple months the net number was flat. In the last couple of months the total of people in federal and state programs has been dropping.
Looking at the following graph shows this slow transition.
To provide a clearer picture of the trend by removing some of the weekly volatility, let’s look at the combined federal and state ongoing claims in three-week increments:
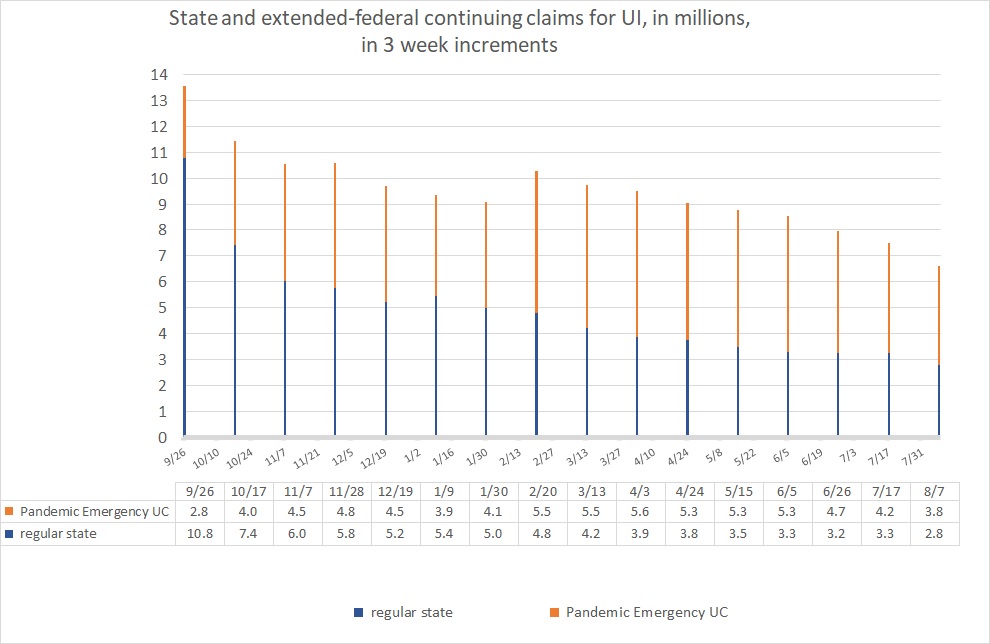
Looking at the three-week increments shows slow improvement until a sharp rise in February. Since February there has been a slow and steady decline in the total number of people drawing unemployment
Data source
Weekly press release from the Department of labor: Unemployment insurance weekly claims. At the end of the report you can find weekly data for this year. Page 4 has a table containing all the numbers I extracted for weekly update to these tables.