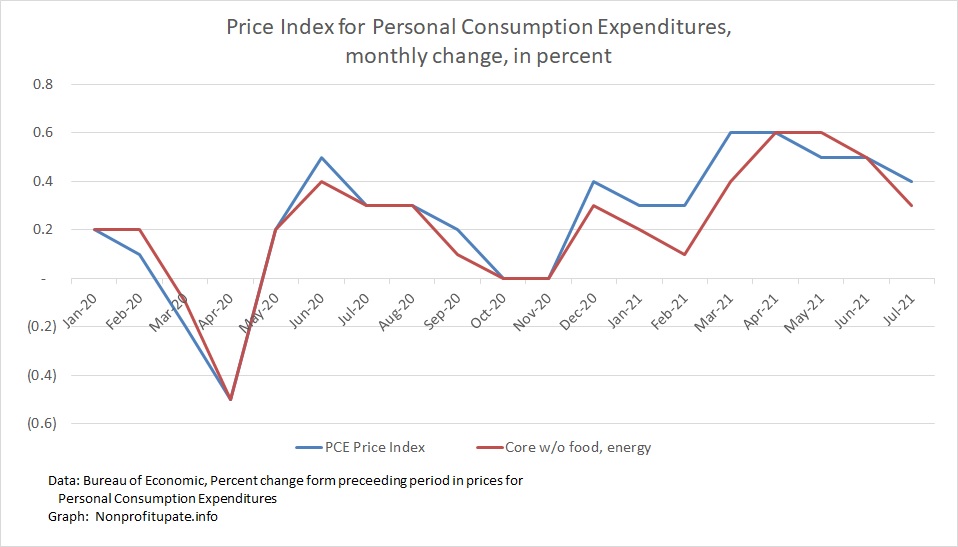
The Personal Consumption Expenditure (PCE) inflation index shows an increase of 0.4% in July 2021. Since December 2020 this index is shown inflation of between 0.3% and 0.6% each month.
This indicates that inflation is continuing. Good news is that inflation is not accelerating. Bad news is an annualized inflation rate of about 6% is continuing.
The PCE is the inflation index preferred by the US Federal Reserve. An intriguing aspect of the PCE is the numbers are routinely revised. This means prior month’s numbers will shift, sometimes by substantial amounts.
Update: The year over year change in PCE is 3.6%. CNBC reports on 8/28/31 Key inflation gauge rises 3.6% from a year ago to tie biggest jump since the early 1990s. To be specific that matches the increase in May 1991 and is second only to the 4.2% increase in January 1991. Current policies of the White House and Congress have given us the highest inflation in 30 years. Not yet Carter era bad, but there is time to achieve Carter level performance.
The CNBC article also says some of the Fed members are starting to see the immediate inflation just might be more than just a temporary adjustment to the economic shutdown. President of the Atlanta Fed acknowledge such possibility when he said on-air that he is hearing from a many of his business contacts that they expect inflation go to beyond the immediate-term.
For more background on PCE, check out previous post Monitoring inflation through the Personal Consumption Expenditure (PCE) price index.
Graph at top of this post shows the monthly change in PCE, including the main index and the core index excluding food and energy. You can see sharp volatility in the March through June 2020 timeframe.
Inflation, as measured by PCE, increased in the December and January timeframe. Starting in March and continues since then there has been high inflation.
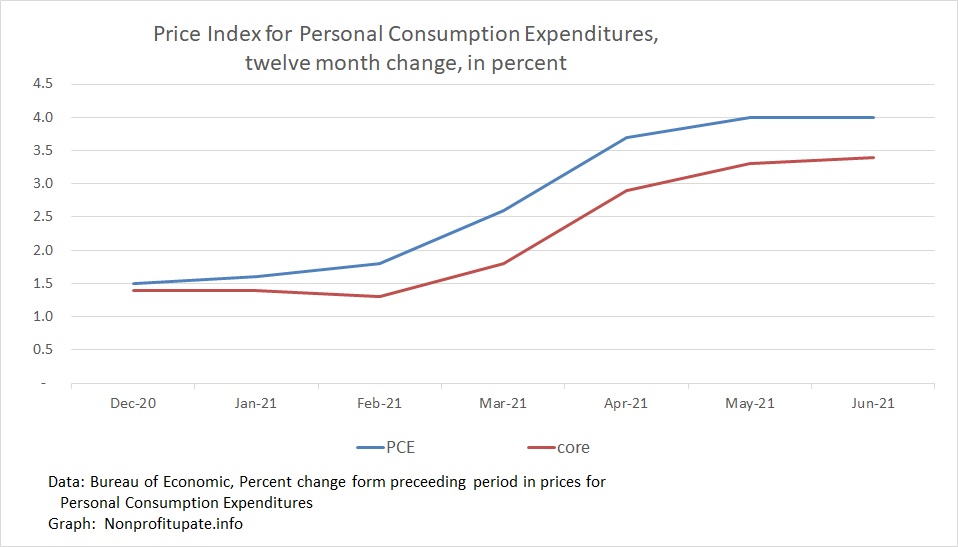
I have calculated the year-over-year change in PCE by summing the last 12 month amounts. The year-over-year change announced by Bureau of Economic Analysis cannot be used because Lee monthly data is revised which means each of the month announcements would need to be restated. Here’s my calculation of the year-over-year change:
The unsettling part of the high inflation numbers since the first of the year is what happened if that is sustained over the course of a year. Let’s consider what that looks like.
Following graph shows an average of the last three months change with an annualization of the monthly change.
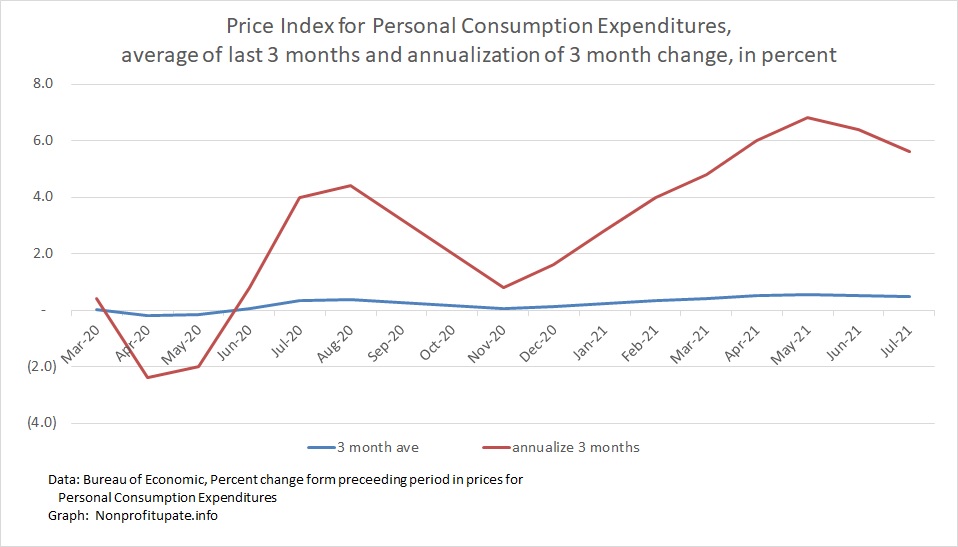
This calculation shows that since February we have been running between 4% and 7% annualized inflation. That makes me nervous.