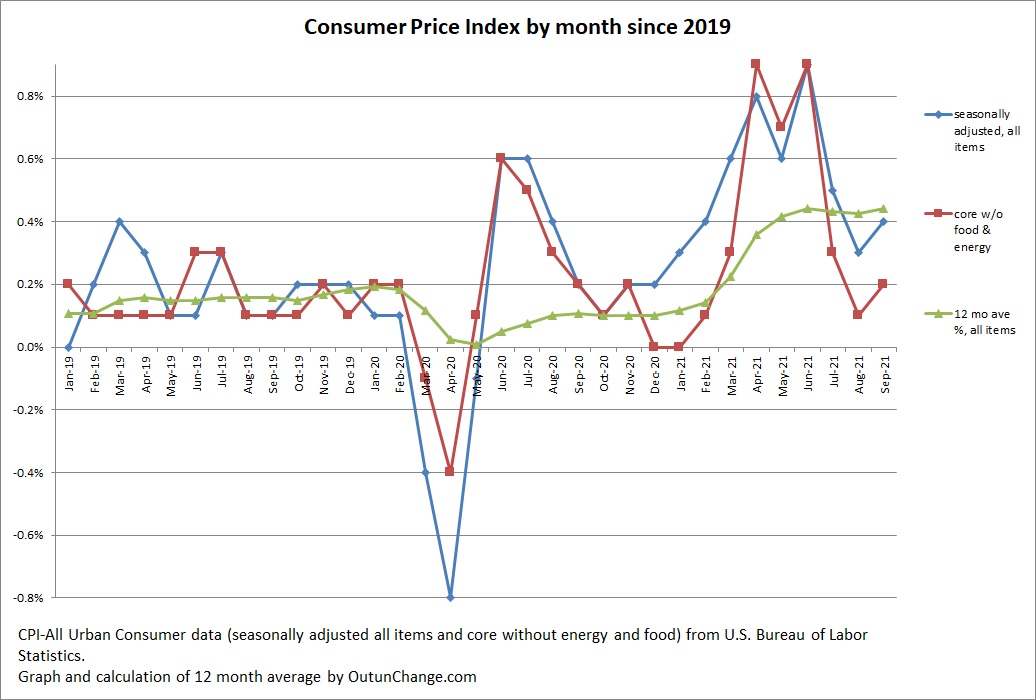
The Consumer Price Index, or CPI, shows a 0.4% increase in September 2021 for all-items with a core increase of 0.2%.
The rate of inflation for the last 12 months is 5.43% for all items and 3.86% for core inflation without food and energy.
Graph at top of this post shows the monthly increase in the all-items index along with the core change. Graph also shows an average of the preceding 12 months for all items.
Watch the green line increase from around 0.1% up to over 0.4% for the last five months.
The trailing 12 month average is also grim. It shows:
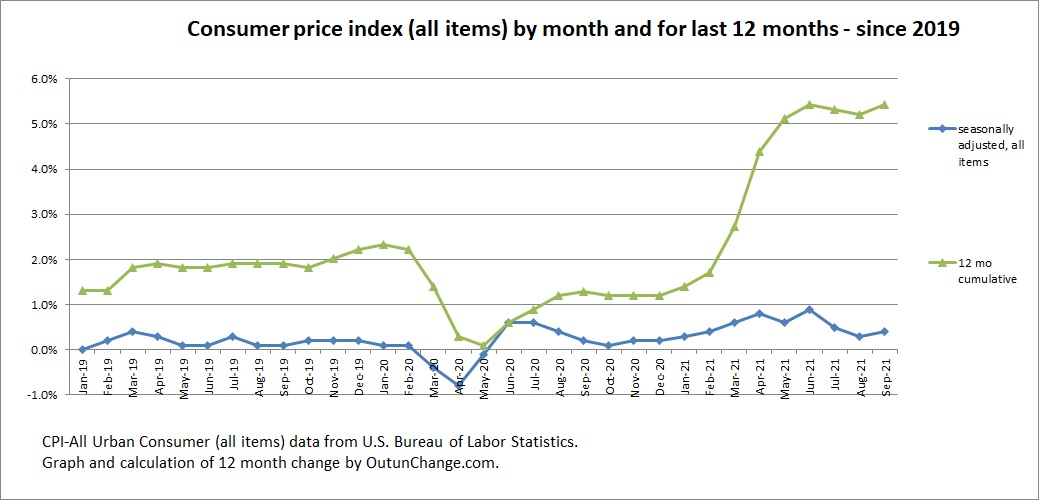
You can see a sharp rise after the shock of the drop in April 2000 works its way out of the 12 month change. The trailing average rapidly jumps to over 5%.
The 4.4% we have seen since January 2021 and the 5.4% twelve-month increase are the sharpest increases in the CPI since 1990. Thirty-one years ago, inflation was 6.2% for 1990. The preceding horror record was 12.5% in 1979.
At the current rate of bad news, we will suffer about the same increase for 2021 as we did in 1990.
Since I am someone who remembers the horrors of Carter inflation (13.2% in 1979 and 12.3% in 1980) I constantly think in terms of annualizing the monthly inflation numbers.
Following graph shows my calculation of the monthly change in CPI, trailing three month average, and an annualization of the most recent three-month change.
What this tells us is how much prices have changed over the three months and then what the annual inflation rate would be if the change in the last three months were to continue for a full year.
The results of annualizing the three-month change:
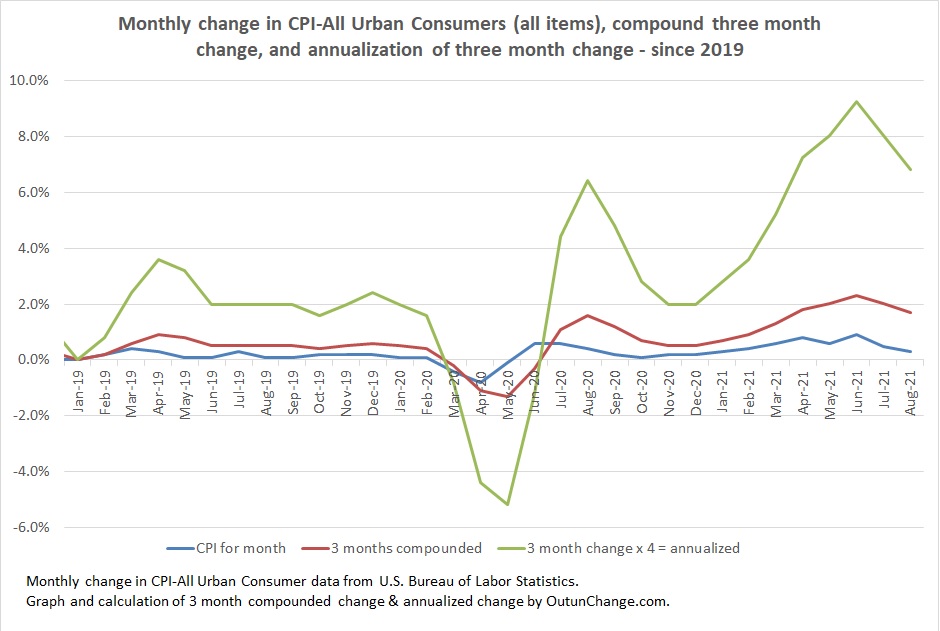
That hints at anywhere from 5% to 9% annualized inflation rate since Spring 2021.