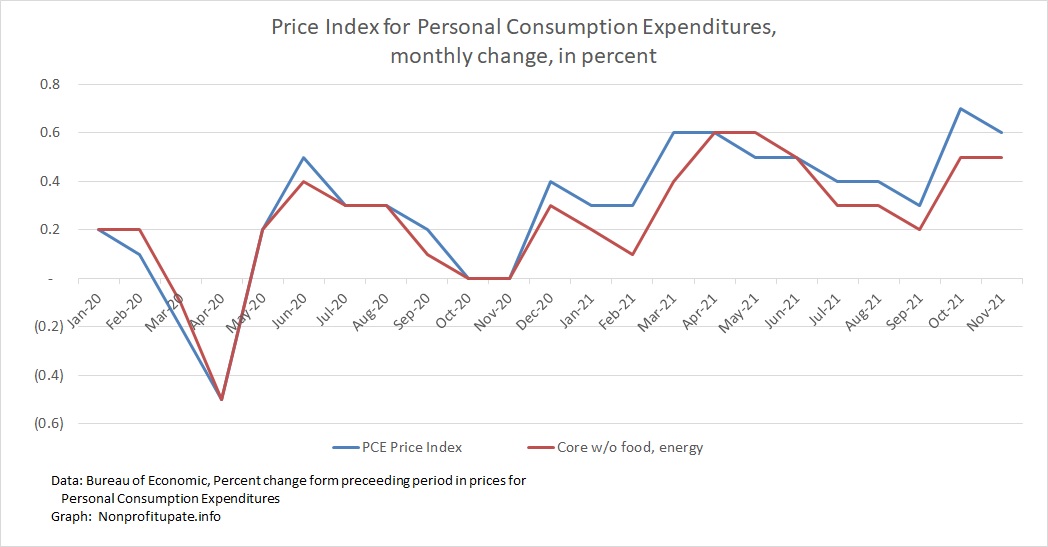
The Personal Consumption Expenditure (PCE) inflation index increased 0.6% in November. This after the 0.6% in October 2021 increase was revised upward from 0.6% to 0.7%.
The core PCE inflation rate (without food and energy) was 0.5% in November and 0.4% in October.
This indicates inflation is continuing. When you look at all of 2021 perhaps inflation is accelerating.
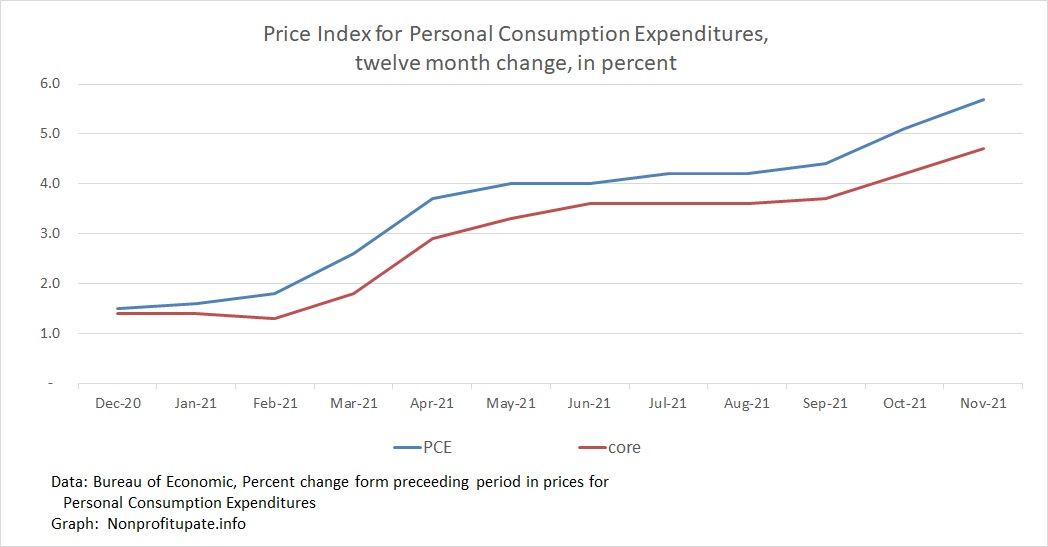
The cumulative 12-month change, according to BEA, has risen to 5.7% for the 12 months through November 2021.
The PCE is the inflation index preferred by the US Federal Reserve. One unique aspect of the PCE is the numbers are routinely revised. This means prior month’s numbers will shift, sometimes by substantial amounts.
Graph at top of this post shows the monthly change in PCE, including the main index and the core index excluding food and energy.
Inflation, as measured by PCE, started increasing in December 2020. There has been high inflation since then.
The Bureau of Economic Analysis updates their calculation of the year over year change as each month’s data is revised. Their calculation of year over year inflation:
The unsettling part of the high inflation numbers since the first of the year is what happens if that rate of inflation is sustained over the course of a year. Let’s consider that unsettling idea.
Following graph shows an average of the last three months change with an annualization of the three-month average.
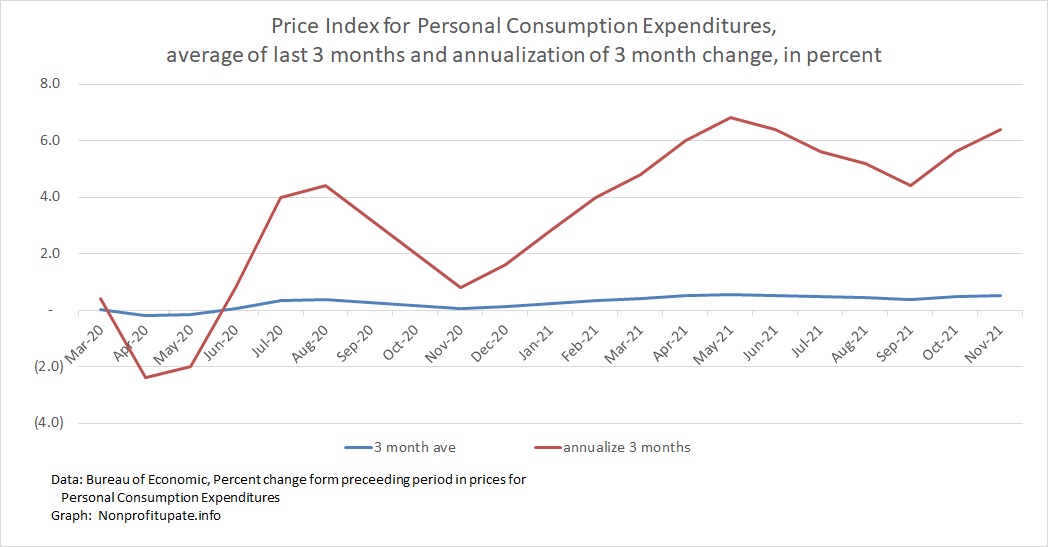
This shows that since March we have been above 4% and bouncing between just over 4% to just under 7%. That is bad news for consumers and the overall economy.
For more background on PCE, check out my earlier post Monitoring inflation through the Personal Consumption Expenditure (PCE) price index.