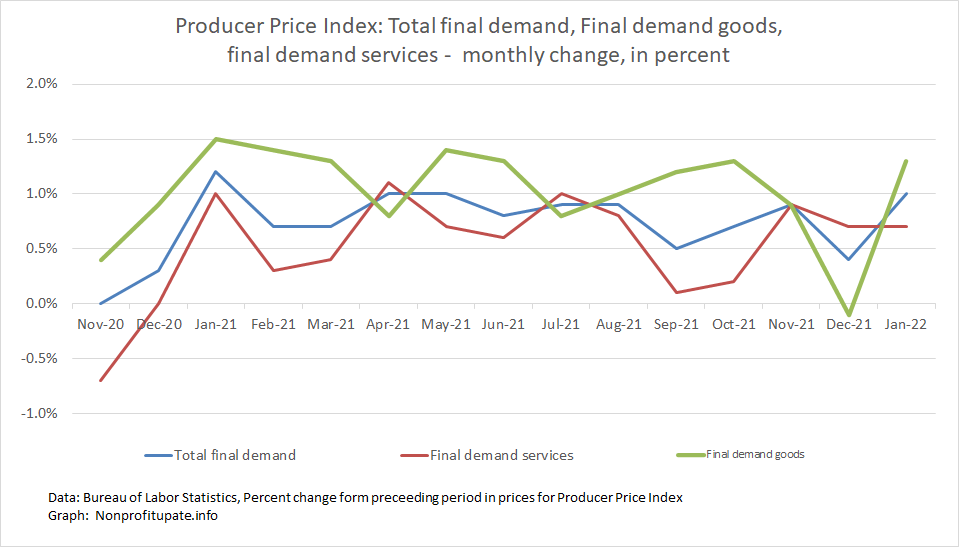
The Producer Price Index (PPI) rose a full 1.0% in January. Final demand goods index was up 0.9% and final demand services rose 0.7%.
The Bureau of Labor Statistics provides a description of PPI:
“The Producer Price Index (PPI) is a family of indexes that measures the average change over time in selling prices received by domestic producers of goods and services. PPIs measure price change from the perspective of the seller. This contrasts with other measures, such as the Consumer Price Index (CPI), that measure price change from the purchaser’s perspective. Sellers’ and purchasers’ prices may differ due to government subsidies, sales and excise taxes, and distribution costs.”
In other words, PPI measures prices received by producers for their goods and services. Those costs roll into the goods and services you and I buy as end consumers.
Another difference between PPI and CPI is the PPI numbers are revised while the CPI numbers once published do not change. I noticed this month that several of the monthly number were revised, with most of the changes being up or down a tenth of a percent. Only one item changed by 0.3. I noticed most of the changes were moving 0.1% from one month to the next.
Graph at the top of this post shows the monthly price change for total demand with separate line for total demand goods and total demand services.
For grim news, here is the year over year change in final demand and core change which means without food, energy, and trade.
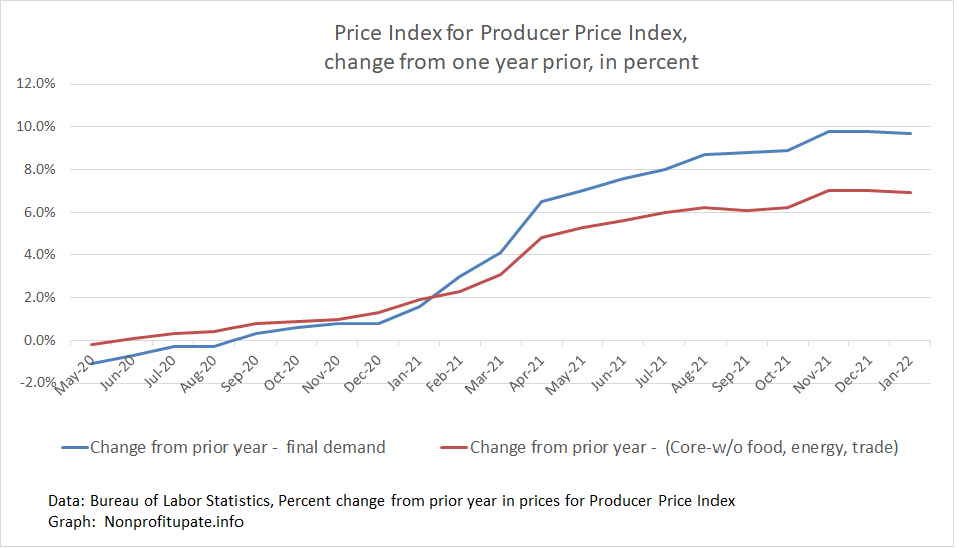
You can see a large increase staring in spring 2021, with increase to around 5% or 7% until fall. Since November the PPI has been running 8% or higher measured year over year.
Ouch.
Having lived through the inflation of the Carter era (yeah, I’m dating myself) I think about high inflation in terms of annualizing the monthly numbers. My calcs look at a three month average and than calculate an annualized rate. That removes the monthly flux. Here are the monthly PPI changes converted to three month average, then annualized:
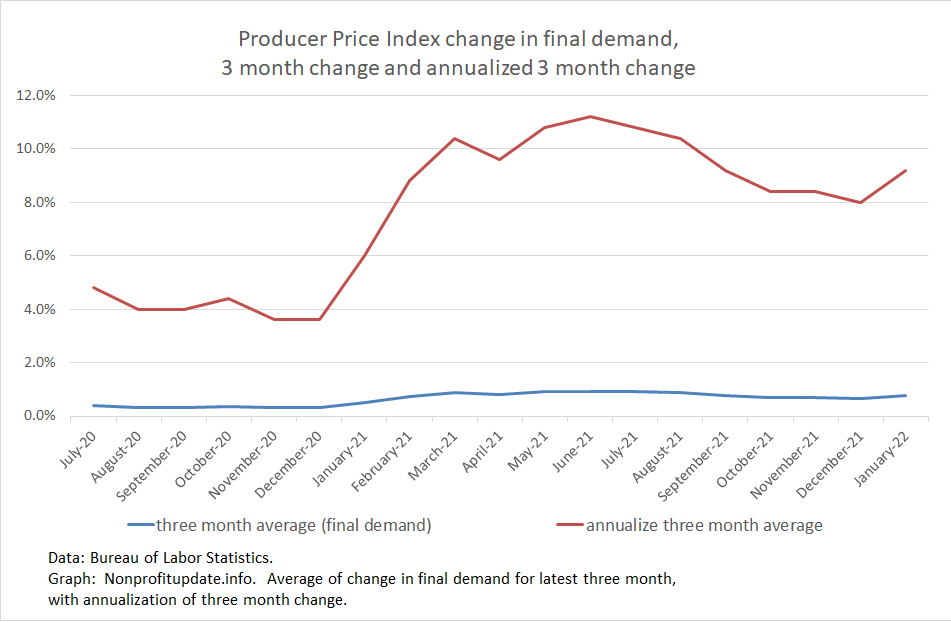
That shows a painful burst in the spring of annualized 10% with *merely* an annualized rate of 8% or 9% for the last five months.
Ouch.