Well, the PCE increased the most in only 39 years, but that’s really close to four decades.
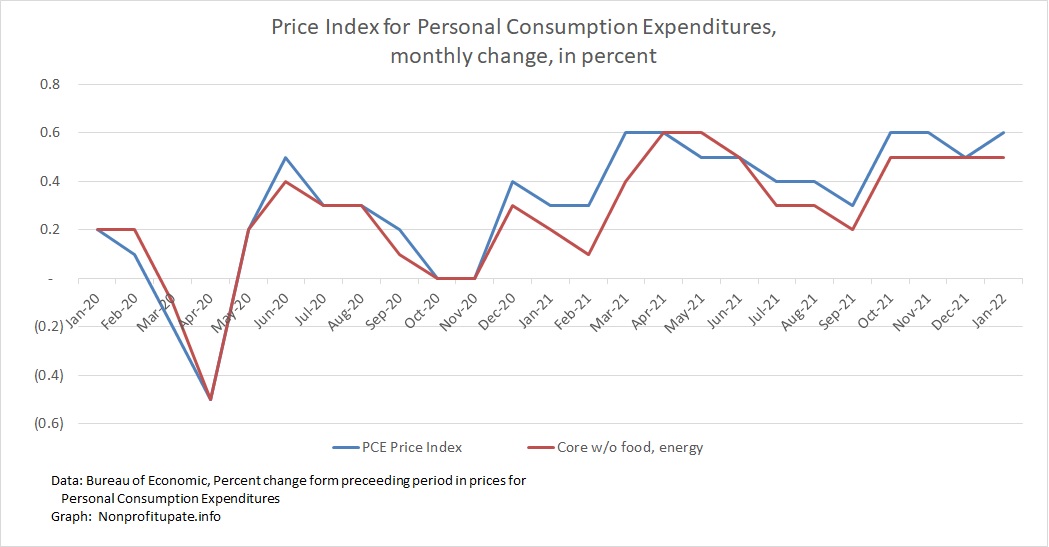
The headline Personal Consumption Expenditure (PCE) inflation index increased 0.6% in January 2022 following December’s increase of 0.5%, which was revised upward from previously reported 0.4%. That follows 0.6% in November and 0.6% in October 2021.
The core PCE inflation rate (without food and energy) was 0.5% in January, matching the 0.5% increase for the previous three months. The October 2021 increase was revised up 0.1%.
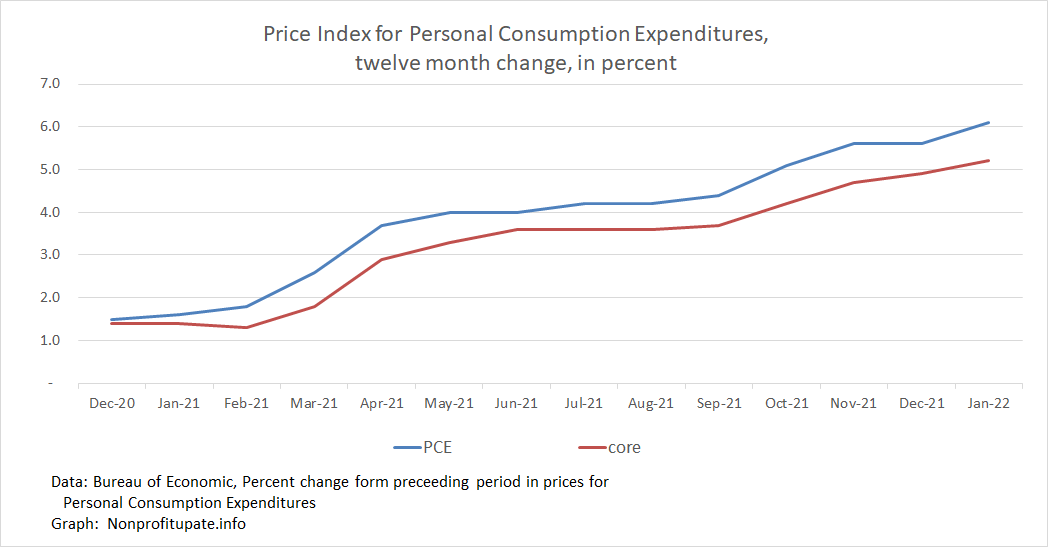
The cumulative 12-month change for 2021, according to BEA, is up 6.1% overall and 5.2% excluding food and energy.
Ouch and ouch.
The PCE is the inflation index preferred by the US Federal Reserve. One aspect of the PCE compared to the CPI is the PCE numbers are routinely revised. This means prior month’s numbers will shift, sometimes by substantial amounts. See comments above for upward revision in 12/21 and 10/21.
Graph at top of this post shows the monthly change in PCE, including the main index and the core index which excludes food and energy.
Inflation, as measured by PCE has been high since December 2020.
For more info, check out CNBC’s report on 2/25/22: Fed’s favorite inflation gauge up 5.2% for bigest annual gain since 1983.
Article says this is the largest increase in April 1983.
1983.
Article also says the announced plan of the Fed is to start raising interest rates in March 2022. Market speculation is the Fed will increase rates by only 0.25% in March, not the 0.50% that was expected before the Soviet Russian invasion of Ukraine. Expectations are the Fed will increase discount rate after each of their meetings for the rest of the year.
The Bureau of Economic Analysis updates their calculation of the year over year change as each month’s data is revised. Their calculation of year over year inflation:
The unsettling part of the high inflation numbers since the first of the year is what happens if that rate of inflation is sustained over the course of a year. Let’s consider that unsettling idea.
Following graph shows an average of three months’ change with an annualization of the three-month average.
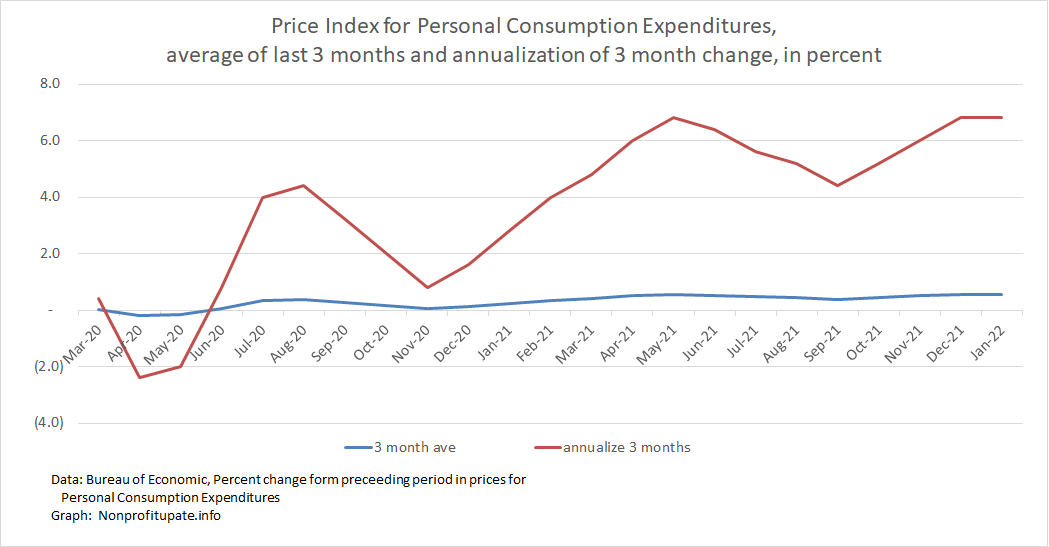
This shows that since March 2021 we have been above 4%. Eyeball the graph and you can see a rapidly rising inflation since June 2020. Think we can permanently bury the ol’ “transitory” thingie the Fed and a host of other U.S. officials were pushing for so many months.
For more background on PCE, check out earlier post Monitoring inflation through the Personal Consumption Expenditure (PCE) price index.