Economics

Large rise new claims for unemployment for week ending 1/9/21.

The number of new claims for unemployment for week ending 1/9/21 increased to 965,000, a deterioration of 181,000 from the prior week.  That is the highest number of new state claims since 8/22/20.

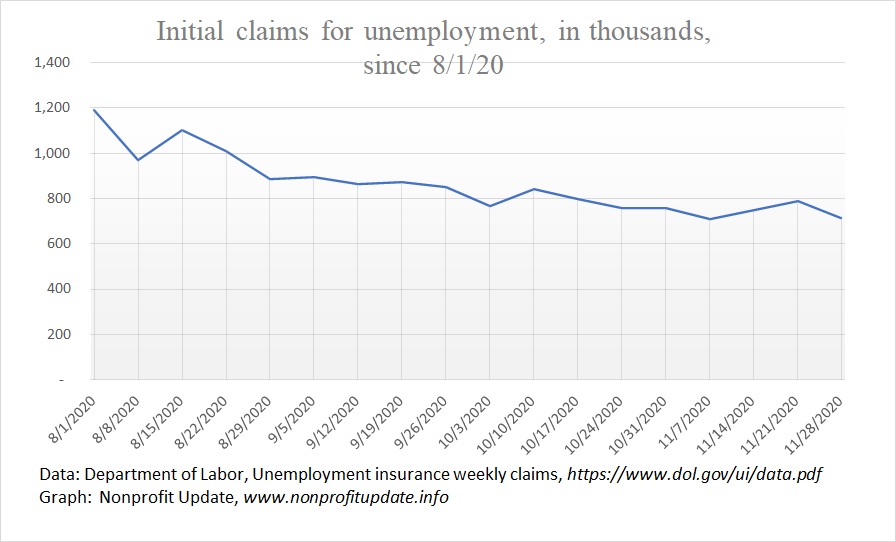
Since 8/29/20, the new weekly claims have been in the 700Ks or 800Ks.

Keep in mind that before the shutdown of the economy the new claims averaged about 220K per week, so we are now running more than four times the previous norm.

The number of continuing claims for unemployment has been slowly dropping but increased for the week ending 1/2/21.

News report

Article at Wall Street Journal on 1/14/21 reports US Unemployment Claims Rise as Pandemic Weighs on Economy. Article link indicates the consensus is the increasing virus count combined with increasing restrictions on businesses caused the jump in new unemployment claims.

Article says there are other economic indicators suggesting the economy is slowing down again. Stats such as small business optimism, new home sales, existing home sales, household income, and household spending point towards a slowdown.

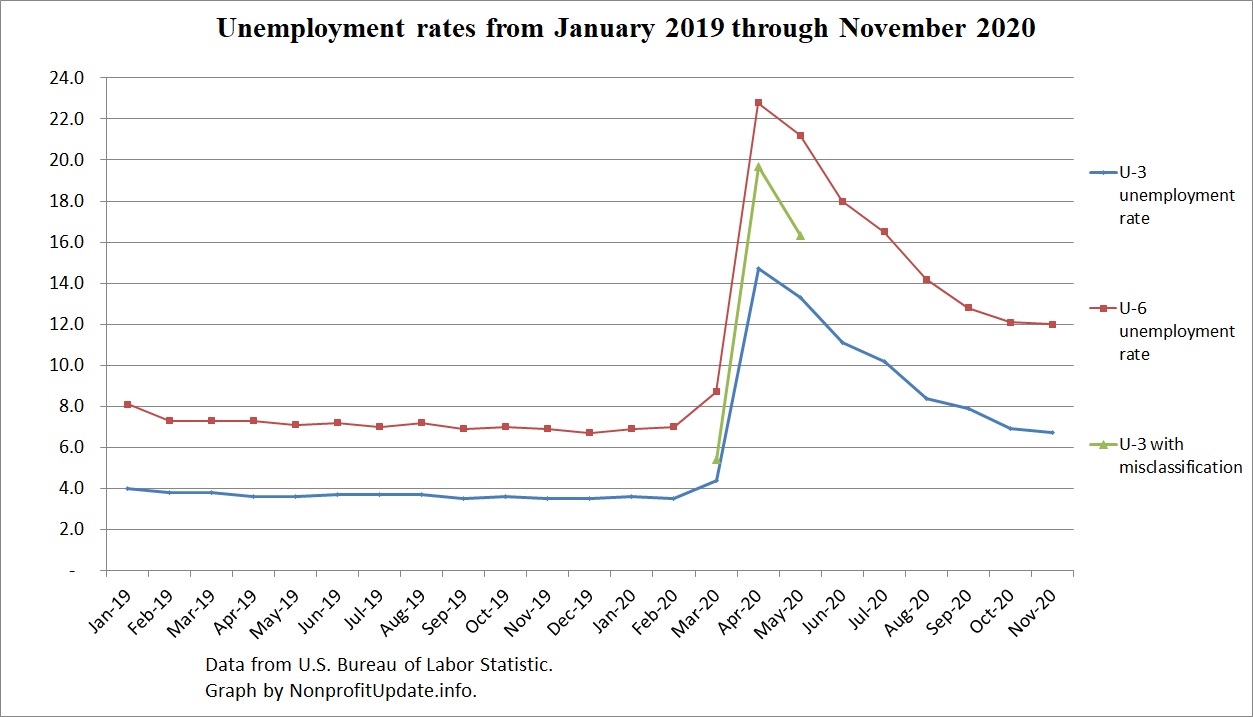
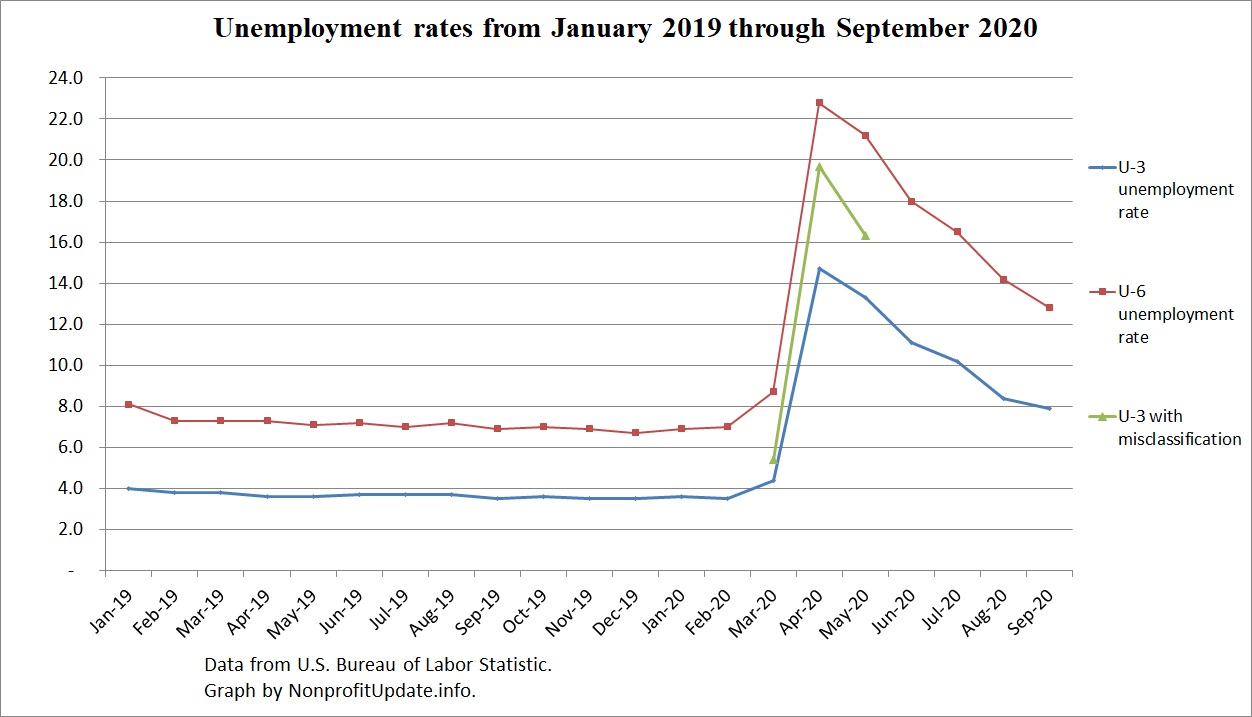
Following graphs show the devastation from the economic shutdown.

New claims

New claims for unemployment by week since the start of 2020:

Small decline in new claims and continuing claims for unemployment for week ending 12/26/20.

The number of new claims for unemployment for week ending 12/26/20 declined for a secone weeks in a row. New claims are 787K, a 19K drop for the week.

This two week drop follows two weeks of increases, which totaled 176K.

Since 8/9/20, the new weekly claims have been in the 700Ks or 800Ks.

For contrast, remember that before the government induced shutdown of the economy the new claims averaged about 220K per week so we are still running three or four times the previous norm.

The number of continuing claims for unemployment is continuing to drop. Large part of the drop is people going back to work. Some portion, likely a lot, of the drop in state-level continuing claims has been offset by rising number of people on the federal program.

When a person exhausts the state level coverage, they become eligible for the extended federal benefits, called the Pandemic Emergency Unemployment Compensation program.

Article at Wall Street Journal on 12/31/20 reports US Unemployment Claims Fell Modestly Last Week.  Article explains the new claims for state programs is a proxy for layoffs. Good observation.

New claims and continuing claims for unemployment increased for week ending 12/5/20.

The number of new claims for unemployment for week ending 12/5/20 increased from 716K in prior week to 853K.

Number of new claims has been in the 700Ks or 800Ks since the end of August.

The number of continuing claims for unemployment increased for the week ending 11/28/20, going from 5.53M up to 5.76M.

Just a few graphs this week:

New claims

New claims for unemployment by week since the start of the year:

Slight decline in new claims and continuing claims for unemployment for week ending 11/28/20.

The number of new claims for unemployment for week ending 11/28/20 declined for two weeks in a row. New claims are 712K, a 75K drop for the week.

In September the new claims were in the 800Ks. Since 10/17/20 the new claims have been under 800K.

For contrast, remember that before the government induced shutdown of the economy the new claims averaged about 220K per week so we are still running more than three times the previous norm.

When a person exhausts the state level coverage, they become eligible for the extended federal benefits, called the Pandemic Emergency Unemployment Compensation program.

The number of continuing claims for unemployment is continuing to drop. Some portion of the drop is people going back to work. Looks like for the lasts four weeks the drop in state-level continuing claims has been offset by rising number of people in the federal program.

New claims for unemployment continue slow decline for week ending 11/7/20; continuing claims dropping quickly.

The number of new claims for unemployment for week ending 11/7/20 again declined. This is the fourth weekly decline, with drops in eight of the last fifteen weeks.  New claims are 709K, a 48K drop for the week.

Starting 8/29/20 the new claims have been in the mid- to high 800 thousands. Since 10/17/20 the new claims have been under 800K.

Remember that before the government induced shutdown of the economy the new claims averaged about 220K per week so we are still running more than three times the previous norm.

The number of continuing claims for unemployment is continuing to drop. Large part of the drop is people going back to work. Part of it is people dropping off the state-level unemployment rolls exhausting coverage.

On 11/12/20, the Wall Street Journal reported U.S. Unemployment Claims Slip but Hold at High Levels. Article asserts the declining new claims and drop in ongoing claims indicates the economy is in a good recovery. Consensus of economists spoken to for the article indicate economy is on a better tract recovery now then the expectations were a few months ago. Current expectation is the GDP will drop 2.7% for the year which is better than the 3.6% expected just last month.

Article suggests that recovery is better than expected.

Tally of people who are now in the extended 13 weeks covered at the federal level is rising rapidly. Here is a recap:

Economic destruction from the shutdown is expanding.

Image courtesy of Adobe Stock.

Economic damage from the shutdown is becoming more obvious as more reporters spend time covering the destruction. Here are two articles each on the overall economic impact, specific impact on individuals, and concentrated impact on two cities:

  • GDP in Italy expected to shrink to the level it was 23 years ago
  • Airline CEOs expect it will take years for the airlines to recover
  • Additional 8 million Americans drop below the poverty level, joining the 55 million who were there before the pandemic
  • All 1,600 orchestras in the country have gone dark; their 160K musicians are unemployed
  • San Francisco has 14% vacancy rate in commercial office space
  • Impact on employment in New York City is more severe than the national average

How long will we let this go on?


Broad indication of the damage:

10/11/20 – India Today – Italy’s GDP in 2022 shrink back to the same level as 23 years ago: Report – …

Why I talk about economic indicators so often.

Image courtesy of Adobe Stock.

One of the frustrations I have experienced as an auditor is the statistical information made visible by the AICPA and publications from others is the economic data lags behind two or three quarters.  Another trade association reports giving trends in the religious communities, but the survey information usually is provided late in the year for the prior calendar year.

Long time ago I came across a comment that CPAs ought to start tracking key economic indicators on their own.

What a great idea!

(Cross-post from my other blog, Nonprofit Update.)

New claims for unemployment rise for week of 10/10/20.

The number of new claims for unemployment for week ending 10/10/20 increased, which offset net declines of the preceding five weeks. New claims are 898K, a 53K increase over the revised tally for previous week of 845K.

Since 8/29/20 the new claims have been in the mid- to high 800 thousands. Change in the last six weeks, starting with 9/5/20 are +9K, -27K, +7K, -24K, -4K, +53K.

Keep in mind before the government induced shutdown of the economy new claims averaged about 220K per week so we are still running about four times the previous norm.

The number of continuing claims for unemployment is continuing to drop. I’m not sure why this is. Part is due to people going back to work. Part of it is people dropping off the state-level unemployment rolls after the 13 weeks of coverage.

Economic damage from shutdown continues to spread.

Image courtesy of Adobe Stock.

Summarized below are a few of the recent articles pointing to expanding economic damage from the shutdown. Destruction in the movie business is noticeable in recent days:

  • Second largest movie chain in the US closes all its theaters
  • Wonder Woman director worried the entire theater industry may die
  • Disney restructures in order to increase focus toward direct-to-consumer distribution channel and away from theatrical release
  • Sales tax collections in San Francisco collapse
  • Passenger cruise ships are getting scrapped

10/5/20 – Wall Street Journal – Regal Cinemas Suspending Operations at All US Locations – The chain with the second largest number of theaters in the U.S. has closed all of its US theaters after having reopened only two months ago. Article does not indicate when any of the theaters will be reopened.

Article says release dates for a dozen movies have been postponed.

New claims for unemployment again drop slightly for week of 10/3/20 (corrected from 10/8).

The number of new claims for unemployment for week ending 10/3/20 continues to decline a bit. Since 8/29/20 the new claims have been in the mid- to high 800 thousands. Change in the last five weeks, starting with 9/5/20 are +9K, -27K, +7K, -24K, -9K.

To again put this in context, before the government induced shutdown of the economy new claims averaged about 220K per week.

The number of continuing claims for unemployment is continuing to drop. I’m not sure why this is. Part is due to people going back to work.

Why I talk about economic indicators so often.

Image courtesy of Adobe Stock.

One of the frustrations I have experienced as an auditor is the statistical information made visible by the AICPA and publications from others is that the economic data mentioned routinely lags behind two or three quarters on the date it is published.  Another trade association reports giving trends in the religious communities, but the survey information is provided late in the year for the prior calendar year.

The result is when I’m working on an audit or review several months later, the readily available economic data is from the start of the fiscal year I’m analyzing. Sometimes the data is for the prior fiscal year I’m considering. That doesn’t do me much good.

Long time ago I came across a comment that CPAs ought to start tracking key economic indicators on their own.

What a great idea!

Did the lockdowns have any beneficial impact on the rate of new infections?

Enough time has passed that there is enough information to start analyzing the lockdowns. Preliminary info is not pretty. Image courtesy of Adobe Stock.

Indications are starting to emerge that the answer to the question may actually be no.

Previously mentioned one analysis which found a weak statistical correlation between weaker lockdown requirements and lower infection rate. The study found no correlation between the date that states started releasing the lockdown restrictions and subsequent infection rates.

The rate of infections accelerates rapidly and then hits an inflection point where the rate of infections either plateaus or the rate slows dramatically.

The following study suggests the lockdowns have no correlation to when the infection rates hit that transition point. In fact, the inflection point normally is reached before the lockdowns could have had any impact.

10/4/20 – National Review – Stats Hold a Surprise: Lockdowns May Have Had Little Effect on Covid-19 Spread

Authors pulled the daily infection rate for 13 states and graphed the data on a logarithmic scale. Seeing infections on a log scale makes it easier to see trends. There are visible transitions in every state from rapid acceleration to a flattened or greatly reduced infection rate.

Economic bad news keeps rolling in, but hint of good news is on the horizon.

Parked airplanes idled by pandemic shutdown. Image courtesy of Adobe Stock.
The bad news on the economy called for the shutdown just keeps growing but there is a hint of good news in the near future. First the good news. 9/30/20 – CNBC – US economy plunges 31.4% in the second quarter but a big rebound is expected – Commerce Department calculations of Gross Domestic Product (GDP) for the second quarter were revised, which is routine, dropping from an annualized contraction of 31.7% down just a little to 31.4% reduction in GDP.