Today we celebrate the most important day in the history of the world.
Easter.
We remember the resurrection of Jesus Christ from the dead.
On the preceding Friday, he was brutally executed by the Roman government at the insistence of the religious leaders. His sacrifice on the cross paid the penalty for sins which we earned and fully deserve.
Was that sacrifice on our behalf accepted by God the Father? Are we pardoned from our sins?
The Sunday morning resurrection proves that yes, the sacrifice by the Messiah was accepted by God the Father as payment in full for your sins and my sins.
As a result, those who have faith in His atoning death are declared free of sin (crazy as that seems, it is true). We will be welcomed into heaven to spend eternity in glory.
Another rendition of this hymn, from Presbyterian Church of Novato with Katy Hatfield (organ), Walter Burge (vocals), & Siri Louie (vocals) on April 4, 2021.
I am pleased to announce my firm has passed its most recent peer review.
The inspection report, which has a grade of “pass”, is for the year ending May 31, 2021. The report is dated December 15, 2021 and was accepted by the state Peer Review Committee on April 7, 2022.
This is the seventh peer review my firm has completed and I am thrilled to share that every time I have received the highest rating possible.
For those not familiar with the peer review process in the accounting profession, this is a self-regulatory program that evaluates the quality of a CPA firm’s quality control over performing audits, reviews, and compilations. It looks at the processes inside a firm and also looks in detail at select engagements to ensure the audits, reviews, and compilations were performed in accordance with professional standards.
The concept is good procedures evidenced by good work on those specific engagements under inspection will result in an overall system that will routinely produce high quality results.
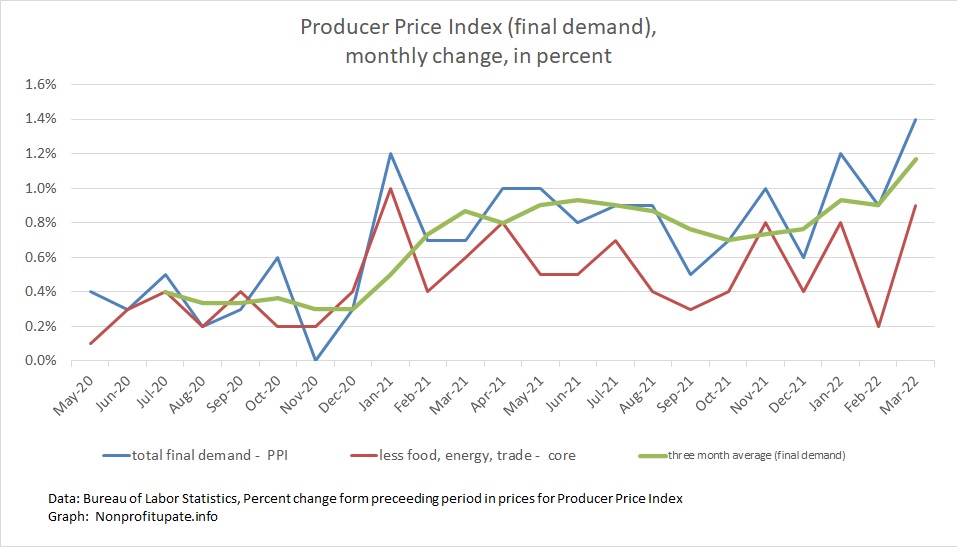
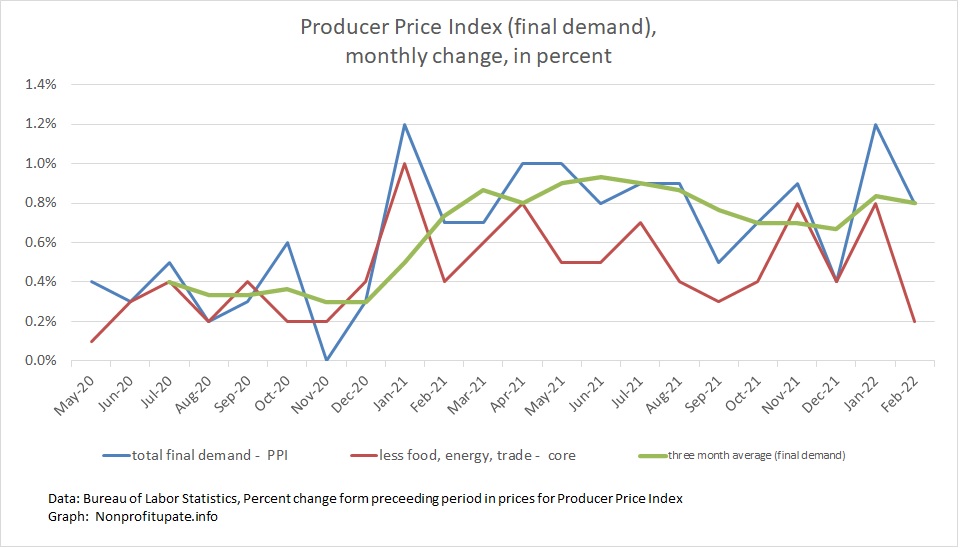
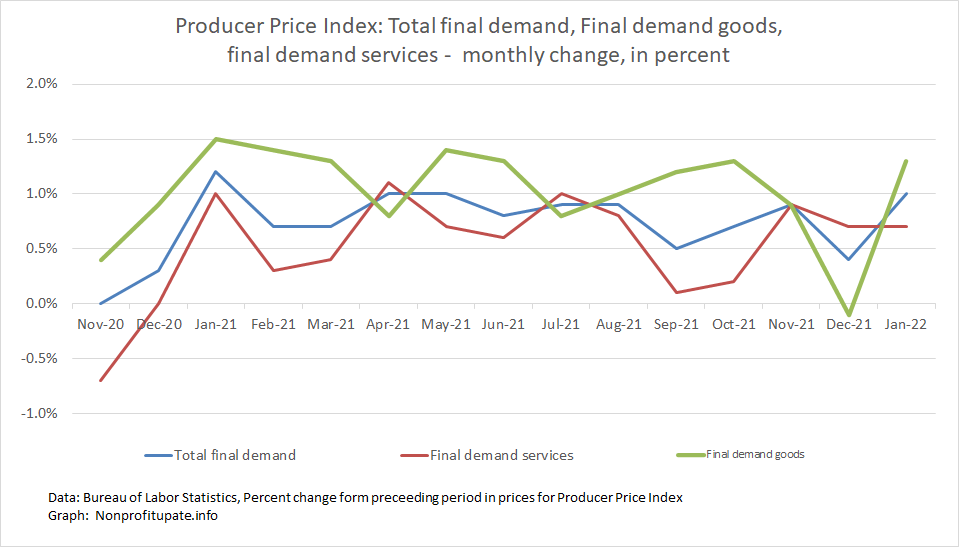
The Producer Price Index (PPI) rose 1.4% in March 2022. This follows the February increase revised up by 0.1% to 0.9%. The January increase was previously revised up by 0.2% to 1.2%.
That is 3.5% in the first quarter of 2022.
The increases are driven by strong consumer demand and constrained supply.
Powerful demand is compounded by trillions of dollars having been flooded into the economy. On the supply side, ongoing supply chain problems are compounded by things like shutting down Shanghai, a city of 27 million which takes off line all their production and stops shipping from a major port. Further restricting the supply side are also soaring energy prices due to U.S. federal policies and the war in Ukraine.
Keep in mind the prior month changes in PPI are revised as needed. This is in contrast to CPI, which is not revised.
This shows there are plenty of increases in wholesale prices, which means there is a lot of inflation heading our way because that is what producers and providers are experiencing. Those increases will hit us consumers soon.
Graph at the top of this post shows the monthly price change for total demand, final demand core (which excludes food, energy, and trade), along with three month average of the final demand.
With revisions, the year over year increase in PPI for recent months is:
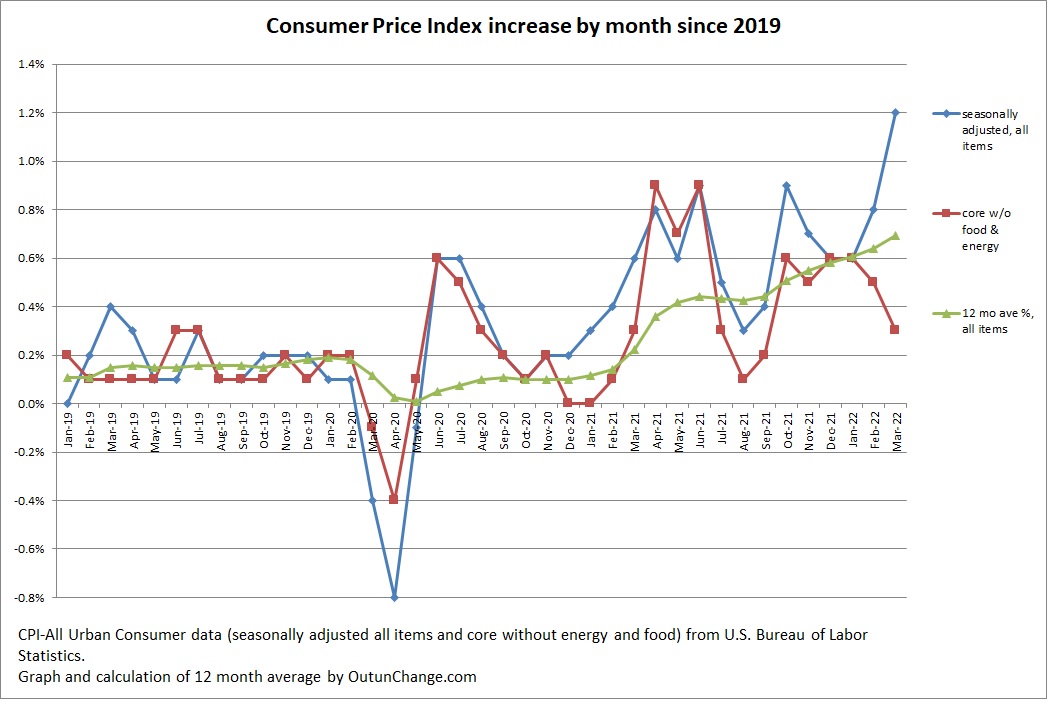
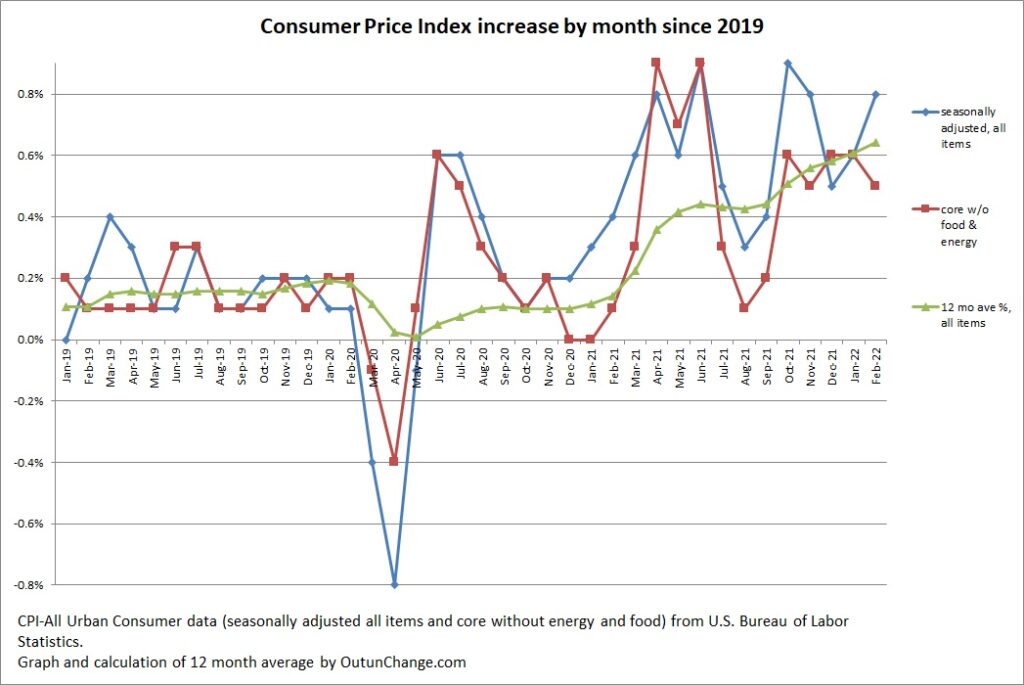
The Consumer Price Index (CPI) increased a staggering 1.2% in March 2022 after 0.8% in February
That is 2.6% for the last three months. Project three months out to a full year would be 10.4%
Graph at top of this post shows the monthly increase in the all-items index along with the core change, which excludes food and energy. Graph also shows an average of the preceding 12 months for the all-items indicator.
By the way, with the CPI accelerating the top number in all of these graphs had to be increased. That is the result of high inflation that is accelerating,
The 12 month cumulative change continues to skyrocket. The monthly change in all items index and the cumulative change for 12 months looks as follows:
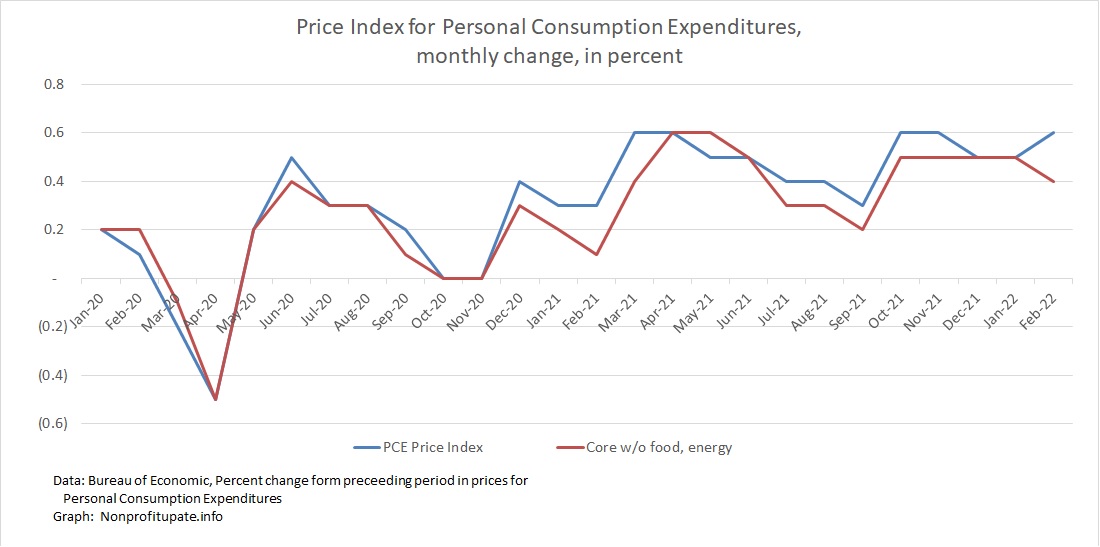
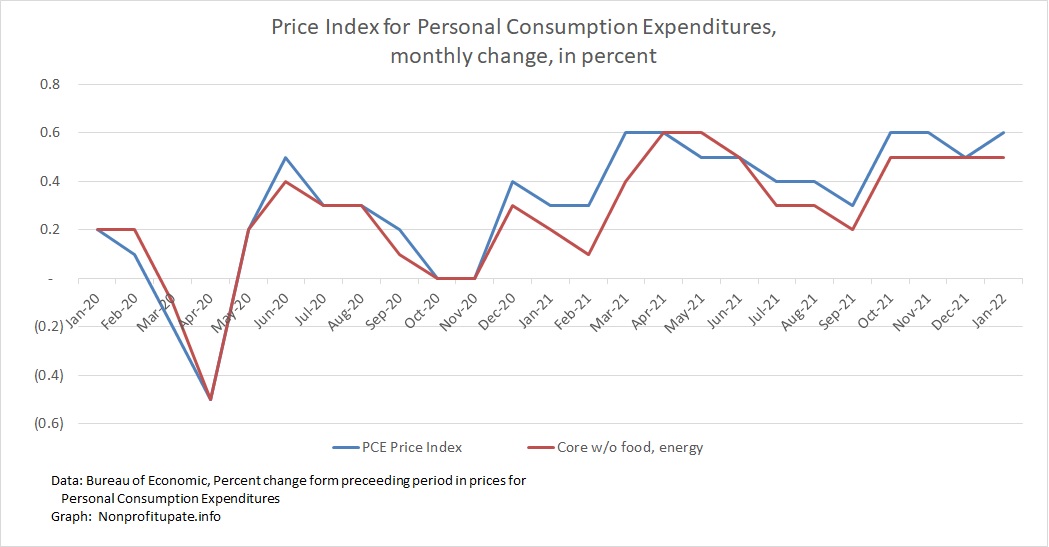
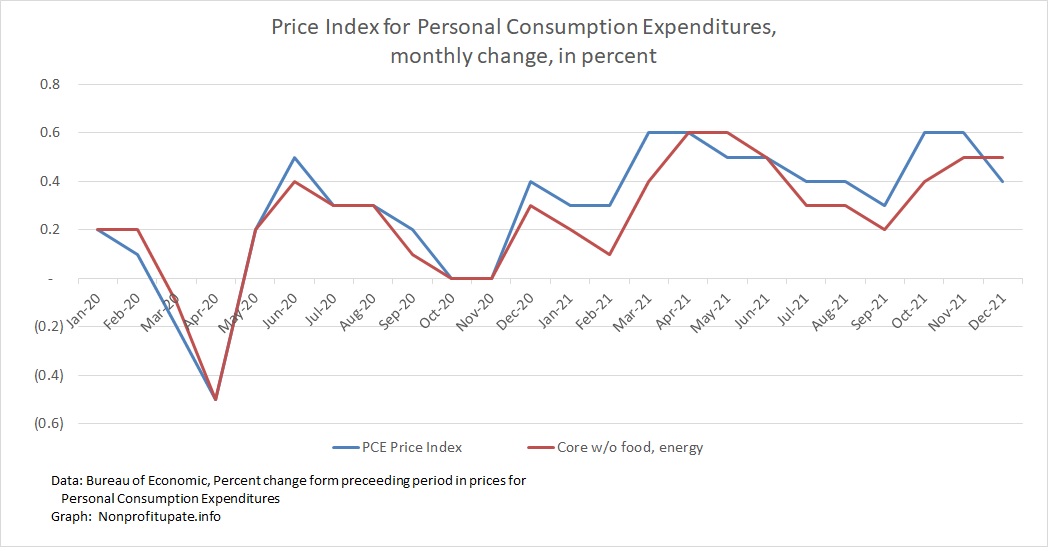
Rising PCE price index is sitting at the highest level since 1982, which is 40 years ago.
Unless you are in your 60s or older, you have little memory of inflation at this severe a level. If this sustains for a few more years, the impact will be brutal.
Personal Consumption Expenditure (PCE) inflation index increased 0.6%, which follows 0.5% in January 2022 which was revised downward from 0.6%.
The core PCE inflation rate (without food and energy) was 0.4% in February, following 0.5% rise in January, matching the 0.5% increase for the previous three months. The October 2021 increase was revised up 0.1%.
The Securities and Exchange Commission issued proposed rules for emissions risk accounting and disclosures by public companies. After the 60 day comment window the SEC will work on final rules.
The proposal creates three areas for measurement and disclosure. Scope 1 is emissions from a company’s own operations, whether it is manufacturing cars, producing coal, or running a bank. Scope 2 is emissions generated from the energy consumed by company as an input to their operations. This could be the electricity to operate the branches and computers of a bank or it could be all of the coal consumed to produce steel.
As if that does not stretch your brain far enough, there is Scope 3. Those are the missions of all of the vendors to a company and all the consumers of its products. This is not just immediate vendors and direct consumers. This includes the emissions of the vendors’ vendors and their vendors, all the way back to when raw materials were first pulled out of the ground.
This includes emissions generated by your customers as they use your products and also your customers’ customers’ emissions. This goes all the way to the end consumer. Furthermore, this is life cycle costs.
As a brain stretcher, for a utility providing natural gas to consumers Scope 3 would include the emissions generated as consumers heat their home. The lifecycle is very short since the gas will be used as soon as it arrives at the houses.
The Producer Price Index (PPI) rose 0.8% in February. The previously reported 1.0% rise in January was revised to 1.2%. So that is actually a cumulative increase of 1.0% in February
Keep in mind the prior monthly increases PPI are revised as needed. This is in contrast to CPI which is not revised.
In February, core PPI, without food, energy, & trade, was up 0.2% in February with January revised downward from 0.9% to 0.8%.
“The Producer Price Index (PPI) is a family of indexes that measures the average change over time in selling prices received by domestic producers of goods and services. PPIs measure price change from the perspective of the seller. This contrasts with other measures, such as the Consumer Price Index (CPI), that measure price change from the purchaser’s perspective. Sellers’ and purchasers’ prices may differ due to government subsidies, sales and excise taxes, and distribution costs.”
So the PPI measures prices received by producers for their goods and services. Those costs roll into the goods and services you and I buy as end consumers.
This means the increases in wholesale prices, which show a lot of inflation, are heading our way as those increases work themselves into the CPI.
Graph at the top of this post shows the monthly price change for total demand with separate line for total demand goods and total demand services.
With revisions, the year over year increase in PPI is 10.0% in February and January, which is only a slight increase from 9.9% in December and November and the increases were just under 9.0% for October back to August.
Take a look at the year over year change in final demand and core change which means without food, energy, and trade.
The Consumer Price Index (CPI) increased 0.8% in February 2022 after increasing 0.6% in January, 0.5% in December 2021, and 0.8% in November.
That is 1.9 % for the last three months.
Graph at top of this post shows the monthly increase in the all-items index along with the core change, which excludes food and energy. Graph also shows an average of the preceding 12 months for the all-items indicator.
The 12 month cumulative change continues to skyrocket. The monthly change in all items index and the cumulative change for 12 months looks as follows:
Well, the PCE increased the most in only 39 years, but that’s really close to four decades.
The headline Personal Consumption Expenditure (PCE) inflation index increased 0.6% in January 2022 following December’s increase of 0.5%, which was revised upward from previously reported 0.4%. That follows 0.6% in November and 0.6% in October 2021.
The core PCE inflation rate (without food and energy) was 0.5% in January, matching the 0.5% increase for the previous three months. The October 2021 increase was revised up 0.1%.
The cumulative 12-month change for 2021, according to BEA, is up 6.1% overall and 5.2% excluding food and energy.
The Personal Consumption Expenditure (PCE) inflation index increased 0.4% in December 20212, which is a slight decline from 0.6% in November and 0.6% in October 2021. The December increase is in line with 0.3% to 0.5% for prior five months.
The core PCE inflation rate (without food and energy) was 0.5% in December following 0.5% November and 0.4% in October
The cumulative 12-month change for 2021, according to BEA, is 5.8% overall and 4.9% excluding food and energy.
Yeah, the research wizards at the Ag Department concluded food inflation in 2021 was exact same as 2020. We will see even smaller price increases in 2022.
US Department of Agriculture – 1/28/22 – 2021 retail food price inflation continued at the same pace as 2020, but varied among food categories – In a clever disinformation effort, the alleged economists at the Economic Research Service of the U.S. Department of Agriculture claim food prices increase of 3.5% during 2021 was the same rate of increase as in 2020. The mere 3.5% during 2021 is only slightly higher than the historical average of 2% from 2000 through 2019.
In newsflash to everyone who actually buys groceries or goes to a restaurant, food prices barely increased in 2021.
(Discussion cross-posted from my other blog, Nonprofit Update, because understanding impact of high inflation on our clients helps us serve them better.)
Because of the pushback this article is already receiving, it will likely be memory-holed momentarily so I will quote a few parts of the article. Will quote the entire article at the end of this post.
The headline information:
“Retail food prices increased by 3.5 percent in 2021, equal to the rate in 2020 and greater than the historical annual average of 2.0 percent from 2000 to 2019. Of the 12 food categories depicted in the chart, six showed slower price increases in 2021 compared with 2020.”
Prices for half the food you buy are coming down. Cool, huh?
Today, January 28, 2022, marks the twentieth anniversary of the Ulvog CPA firm.
It has been a joy to serve the nonprofit community for these two decades as an independent CPA firm. Focusing on the religious nonprofit community has been a professional honor and a personal delight.
Thanks to all the organizations who have made this journey possible.
Looking forward to many more years of serving churches and ministries.