You cannot turn an economy off, then turn it back on. Here are the results when hubris makes you think you found the magic switch. Part 2.
Seems like most industries have a tangled supply chain. The entire transportation system is sorely distressed.
The elitists in federal and state governments have a staggering level of hubris. They think waving their hands, clicking on their laptops, issuing press releases will make the entire economy bend to their will. What they accomplish is willfully causing disruption in your life and in my life.
Here are merely a few of the recent articles describing the tangled impact of Covid dictats and sundry government policies:
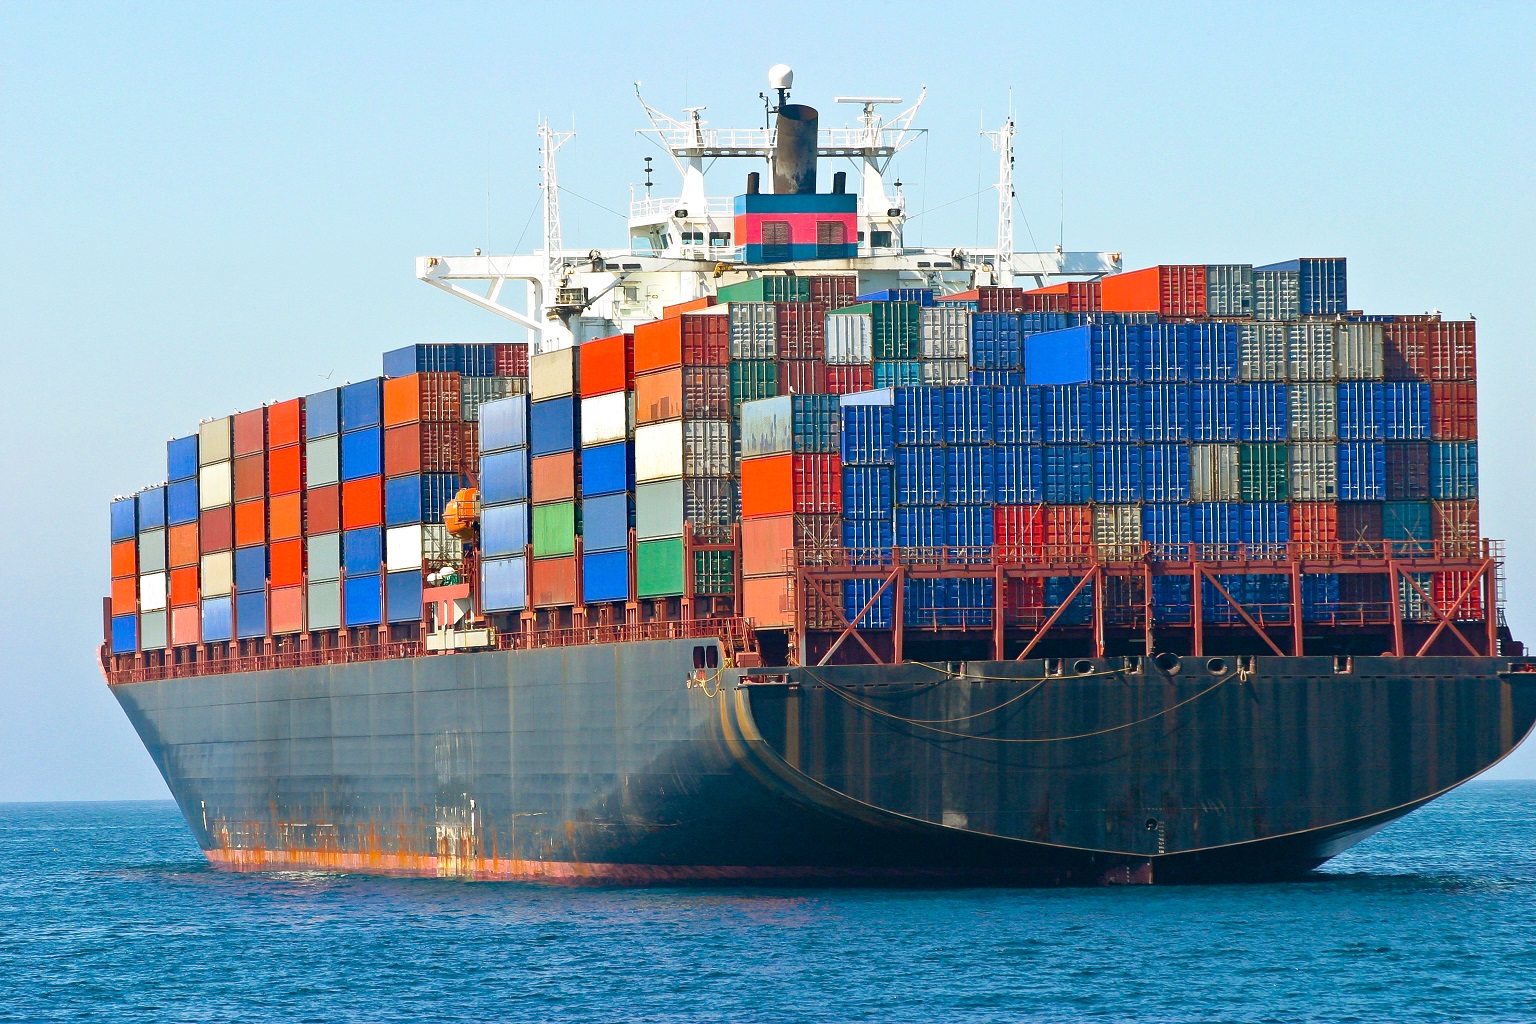
- Lots of cargo ships are waiting to unload off the California coast.
- Large port operator expects disruptions to last into 2023.
- Workers in transportation sector warn of possible system collapse.
- Chip shortage for carmakers will last into late 2022.
Looks like it might take another 15 or 18 months to untangle the worldwide supply chain.
Wall Street Journal – 8/17/21 – Cargo Ships Are Again Idling Off Jammed Southern California Ports – Back in the middle of August the tally of cargo ships sitting off to coast of California was 37.
A tweet I saw this morning (10/9/21) from someone flying out of Long Beach indicated the individual counted 50 ships waiting to unload.
At around 10,000 containers per ship that is somewhere around 370,000 containers waiting to be unloaded back in the middle of August and is now currently somewhere in the range of half a million containers sitting off the coast.
Article says a few months ago it was only nine. Normally it is zero.
…