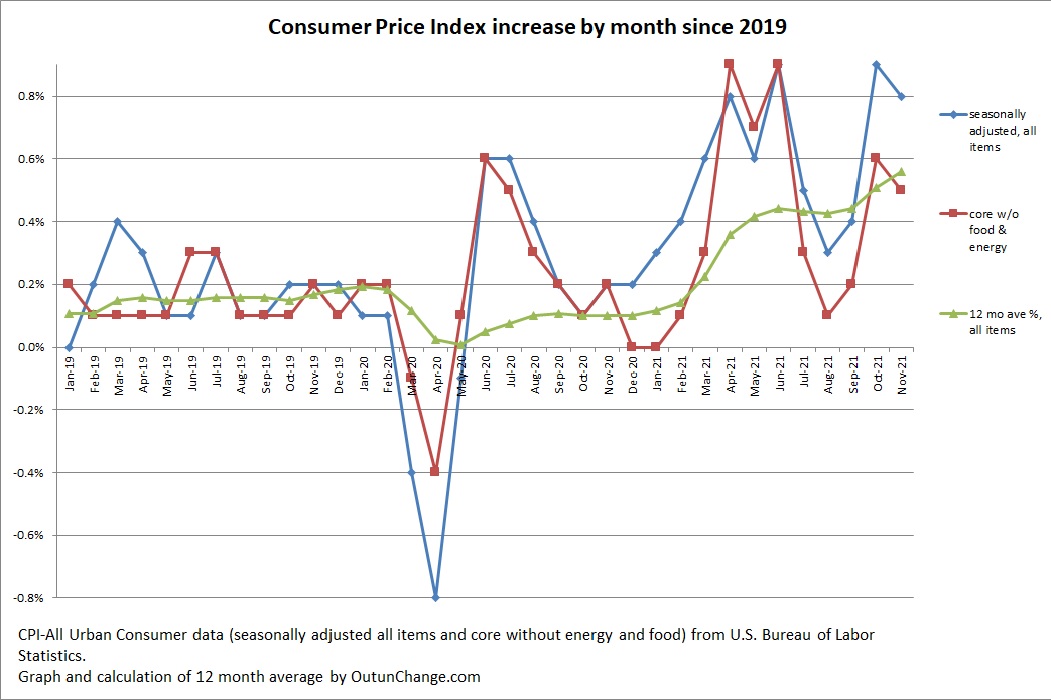
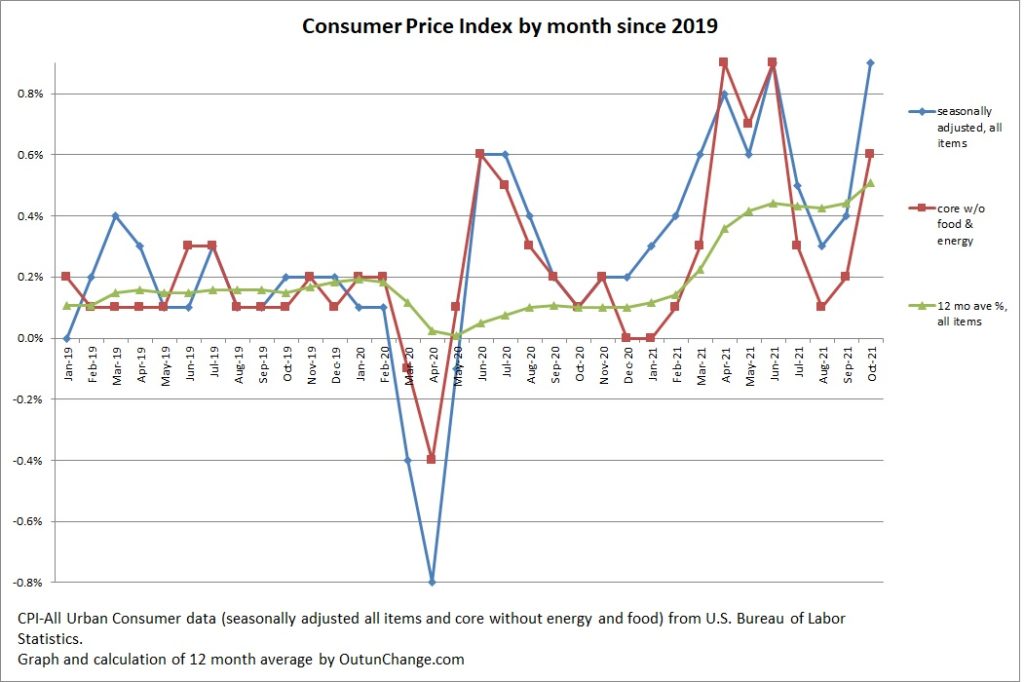
The Consumer Price Index (CPI) increased 0.8% in November after a 0.9% increase in prior month.
That is 2.1% for the last three months, which would be about 8.4% if the increase in the last three months continued for a year.
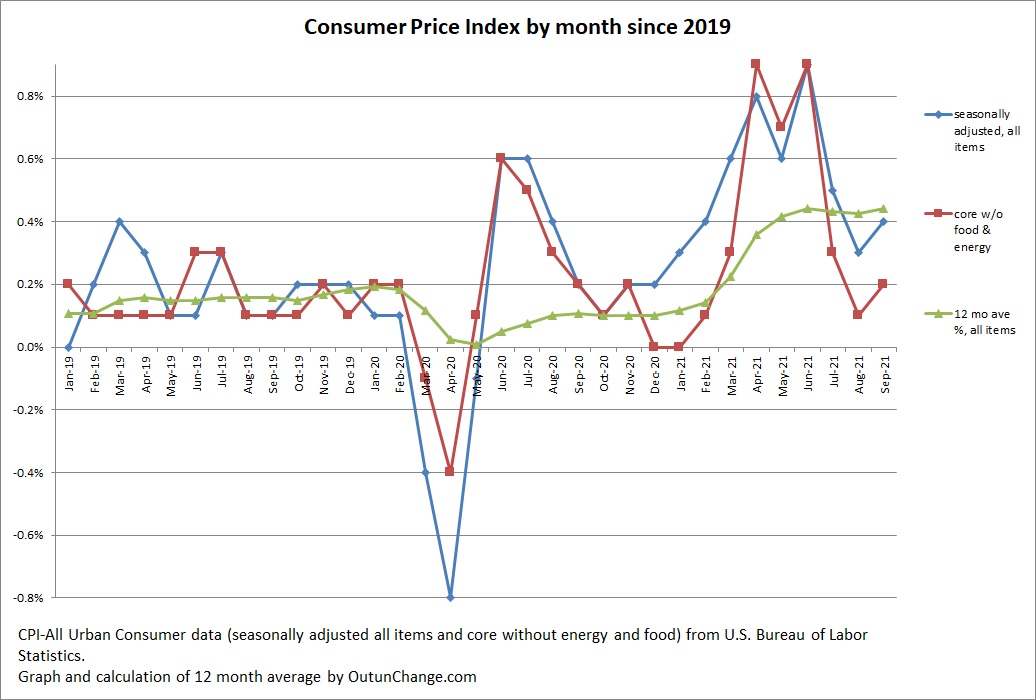
Graph at top of this post shows the monthly increase in the all-items index along with the core change, which excludes food and energy. Graph also shows an average of the preceding 12 months for the all-items indicator.
The 12 month cumulative change is distressing. The monthly change in all items index and the cumulative change for 12 months looks as follows:
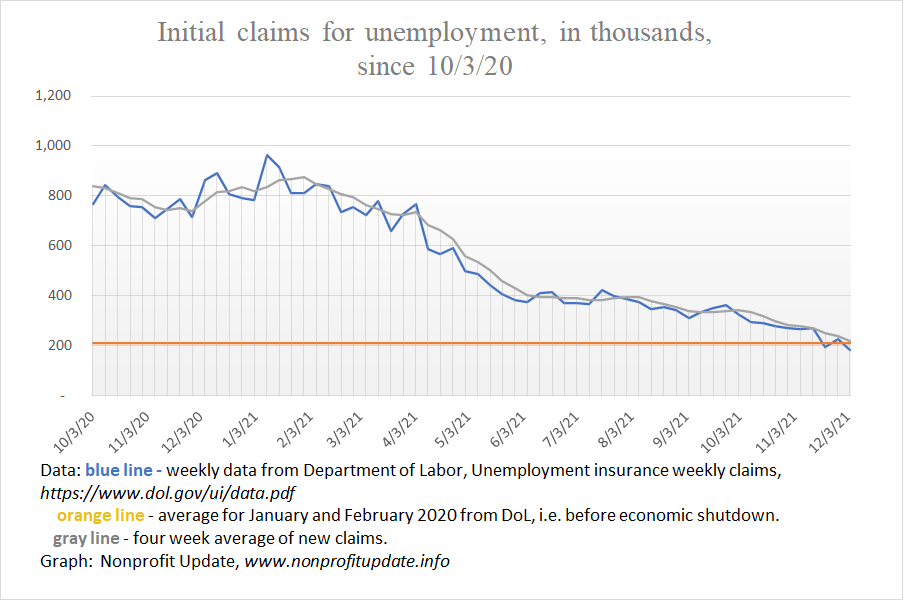
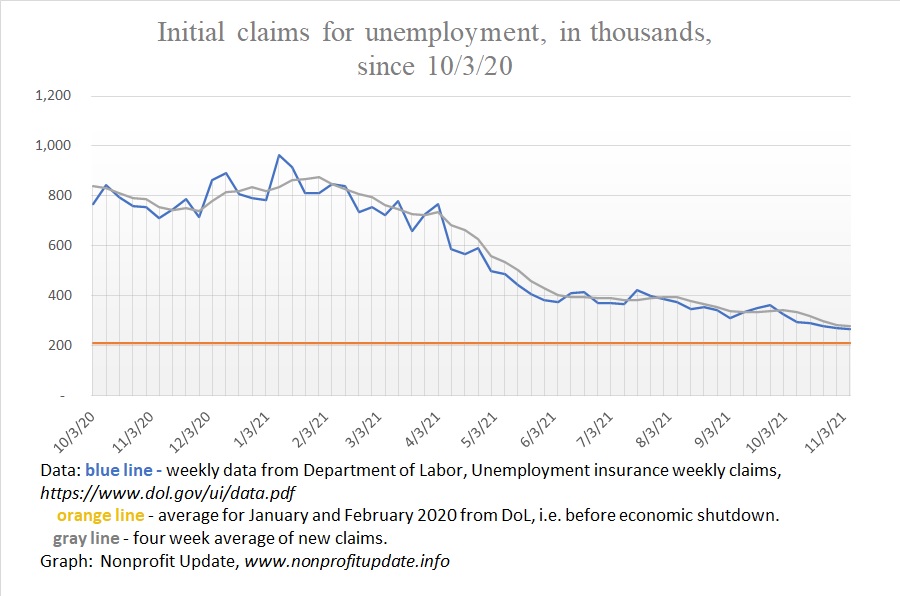
The number of people filing first-time claims for unemployment is now at the level before the pandemic started.
For the week ending 12/4/21 there were 184,000 new claims. The four-week average is 219,000 which is almost a match to the average of 212,000 average in January and February 2020.
The number of people drawing unemployment insurance is 1.99 million which shows a continual decline and is approaching the 1.72 million average before the pandemic.
Yet the civilian labor force is still 2 million below the start of the pandemic and the number of people not in the labor force is 5 million higher. Everywhere you look you see help wanted signs and in my tiny corner of the world I have seen restaurants cutting back service or closing in the middle of the workday. Everywhere you look you read about a massive shortage of staff.
Part of the explanation for this confusing picture is common to read about the surprisingly low number of new claims. Speculation in several articles I read is this reflects employers being very hesitant to let go of workers if they think they will be unable to find new staff if needed in the near-term.
The amount of money Congress has pumped into the economy in an attempt to fight the Covid pandemic is staggering. Don’t quite have enough adjectives to describe the amount of money that is forced into the economy without any corresponding increase in production.
The amount spent directly on the pandemic is more than four times the annual budget at the federal level.
This is one of the primary reasons we are seeing inflation rates running at a thirty year high.
I’ve pulled together the amount of money appropriated by Congress in 2020 and 2021 which are focused on fighting the pandemic and stimulating the economy. Here is my tally, with amount of funding in billions of dollars, date Congress passed the legislation, and name of the program:
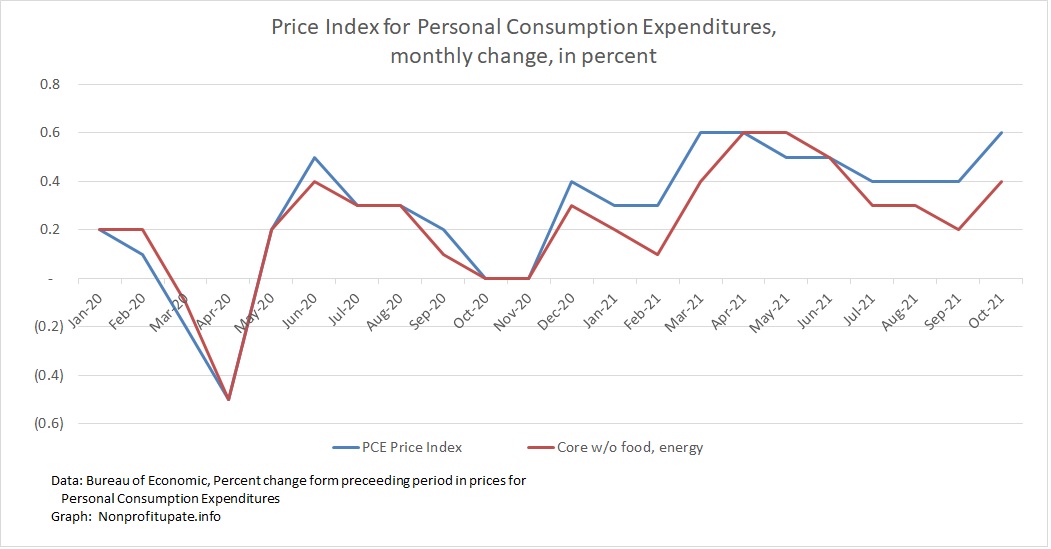
The Personal Consumption Expenditure (PCE) inflation index increased 0.6% October 2021. This is a jump from the 0.4% in July, August, and September. The 0.6% matches the increase in March and April.
The core PCE inflation rate was 0.4% in October which is in the middle of the range from March 2021 through September.
This indicates inflation is continuing and perhaps accelerating.
The cumulative 12 month change, according to BEA, has risen to 5.0% for the 12 months through October 2021, compared to 4.2% for the 12 months ending September.
The number of new claims for unemployment is slowly declining.
For the week ending 11/6/21 there were 267,000 new claims. While this is encouraging progress, keep in mind the number of people who are getting laid off is still far above the average of 212,000 per week all the way back in January and February 2020. We are still seeing more people laid off every week than before the pandemic began.
Here is a recap of newly unemployed over the last several months:
The Consumer Price Index (CPI) increased 0.9% in October 2021 after a more modest 0.4% increase in September and 0.2% in August.
The October increase matches the June increase of 0.9% and is slightly higher than April increase of 0.8%.
Diving into the components of the CPI shows the increases are broader than several months ago.
The press release from the Bureau of Labor Statistics explains:
“The monthly all items seasonally adjusted increase was broad-based, with increases in the indexes for energy, shelter, food, used cars and trucks, and new vehicles among the larger contributors. The energy index rose 4.8 percent over the month, as the gasoline index increased 6.1 percent and the other major energy component indexes also rose. The food index increased 0.9 percent as the index for food at home rose 1.0 percent. “
Warning sign as we roll into winter is fuel oil increased 12.3% in October and utility gas increased 6.6%. Keep in mind those are changes for the month, not for the year.
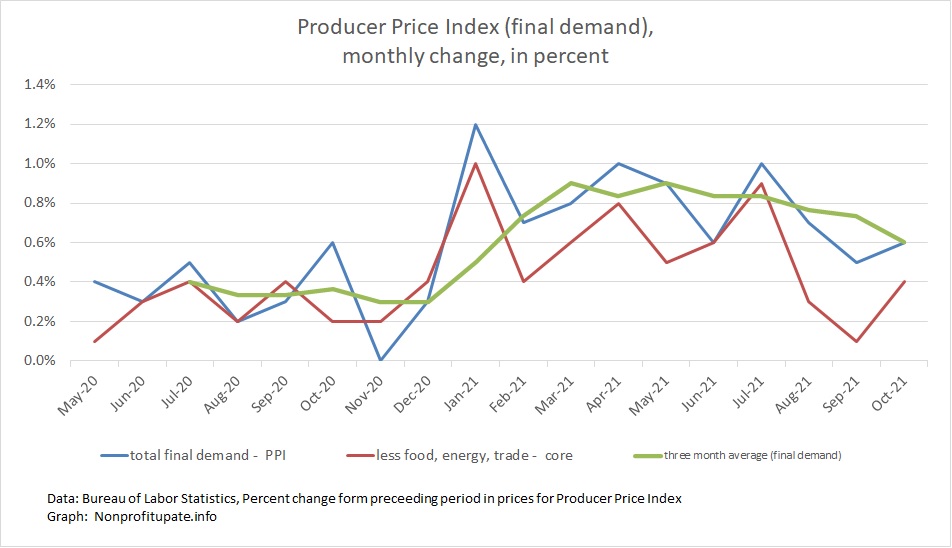
The Producer Price Index (PPI) in October 2021 continues to show unusually high and ongoing inflation. Increasing October was 0.6%, which follows a 0.5% increase in September and 0.7% increase in August.
The PPI has shown high inflation for all of 2021. The worst months were 1.2% in January, 1.0% in April, and 1.0% in July. Those extremes have not repeated for the last quarter, which is a small amount of good news.
Graph at the top of this post shows the monthly change and final demand (the total index in other words) in blue. The average of the monthly changes in green. The red line shows core change, which excludes food, energy, and trade.
The PPI was increasing around 0.4% the month until the end of 2020. Since then it has averaged 0.8% for 2021 through October. Ouch.
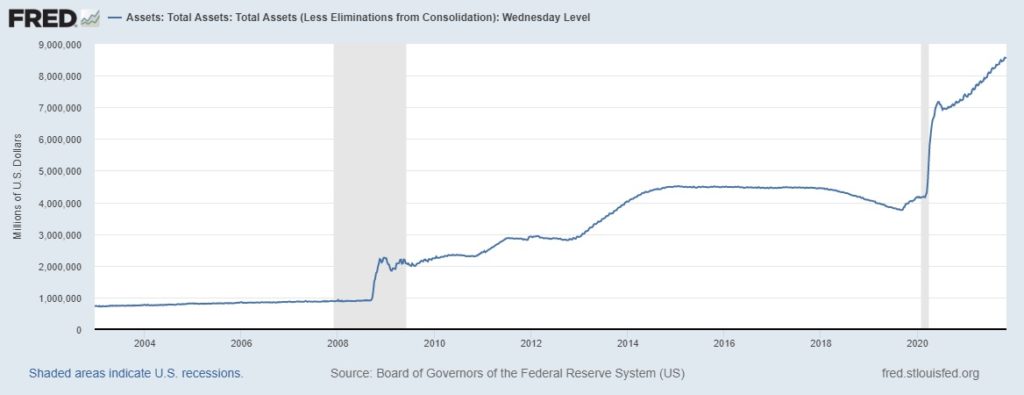
Got to wondering how much money the Fed has created out of thin air and then pumped into the economy. The answer is a vague “bunches and bunches.”
How do I know that? Because of my reading over the last few years. I pay attention to such stories (yeah, yeah, I know – I’m weird – pray for me as you feel led). I also am aware the Fed pumped a lot of money into the economy when the pandemic started.
There have been lots of news reports commenting they have been pumping something in the range of $100 billion a month into the economy after their initial round.
As I was thinking about things the federal, state, and local government have been doing to harm the economy, got to wondering just exactly how much fiat money the Fed has been creating, out of thin air of course. Yeah, I wonder about such things.
Answer is again bunches and bunches, and is measured in trillions of dollars.
Graph above shows the amount of total assets on the Federal Reserves balance sheet since around 2003.
Damage from the forced economic shutdown is being compounded by the trillions of deficit spending and lots of articles are suggesting there is more inflation on the horizon.
A few of the recent articles pointing toward higher prices in near future:
Supermarket billionaire expects 10% run up in food prices in near term
P&G raising prices.
Two big-time investors are seeing inflation now and expect more.
Pressure on car shortages may get worse due to lack of magnesium, which will drive prices higher.
Fox News – 10/18/21 – Food prices will go out “tremendously”: Billionaire supermarket owner– The president of Gristedes and D’Agostine Foods is guessing there will be something in the rate of 10% jump in food prices over the next two months. Rising prices and supply limits are working their way through the supply chain. He expects grocery stores will stop promotions and reduce the range of products they carry.
Wall Street Journal – 10/19/21 – Proctor & Gamble Uses Its capsize to Lesson Impact of Supply-Chain Mess – P&G announced it will start increasing prices of razors along with some beauty and oral care items. Previously they announced they would be increasing prices for diapers and toilet paper. Amount of increases was not announced.
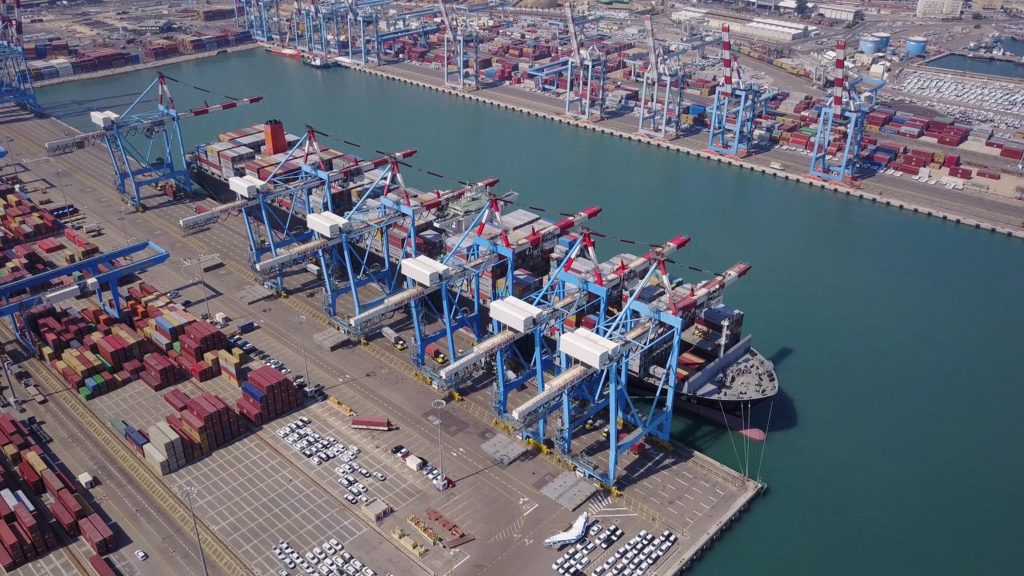
The supply chain for so many of the things we buy is messed up at every step of the logistics system. Former CEO of Walmart pointed out the steps in the supply chain that are tangled up:
Loading ships at ports in Asia.
Ships are stuck in the water waiting to unload.
Unloading at ports in the US is another chokepoint.
There are not enough truck drivers.
Not enough labor and the various points in the distribution system inside the United States.
Shortage of people to put stuff on the shelves.
Essentially every stage of the distribution channel is tangled up. Biggest thing that could be done to get things moving normally would be more people to work at every step of the distribution system. Labor shortages, in other words.
This post discusses two articles:
California has imposed restrictions on trucking which has drastically reduced the number of trucks which can be operated in the state.
One article provides us a survey of a dozen other articles, each of which describes a different aspect of the supply chain disaster.
The Consumer Price Index, or CPI, shows a 0.4% increase in September 2021 for all-items with a core increase of 0.2%.
The rate of inflation for the last 12 months is 5.43% for all items and 3.86% for core inflation without food and energy.
Graph at top of this post shows the monthly increase in the all-items index along with the core change. Graph also shows an average of the preceding 12 months for all items.
Watch the green line increase from around 0.1% up to over 0.4% for the last five months.
The trailing 12 month average is also grim. It shows:
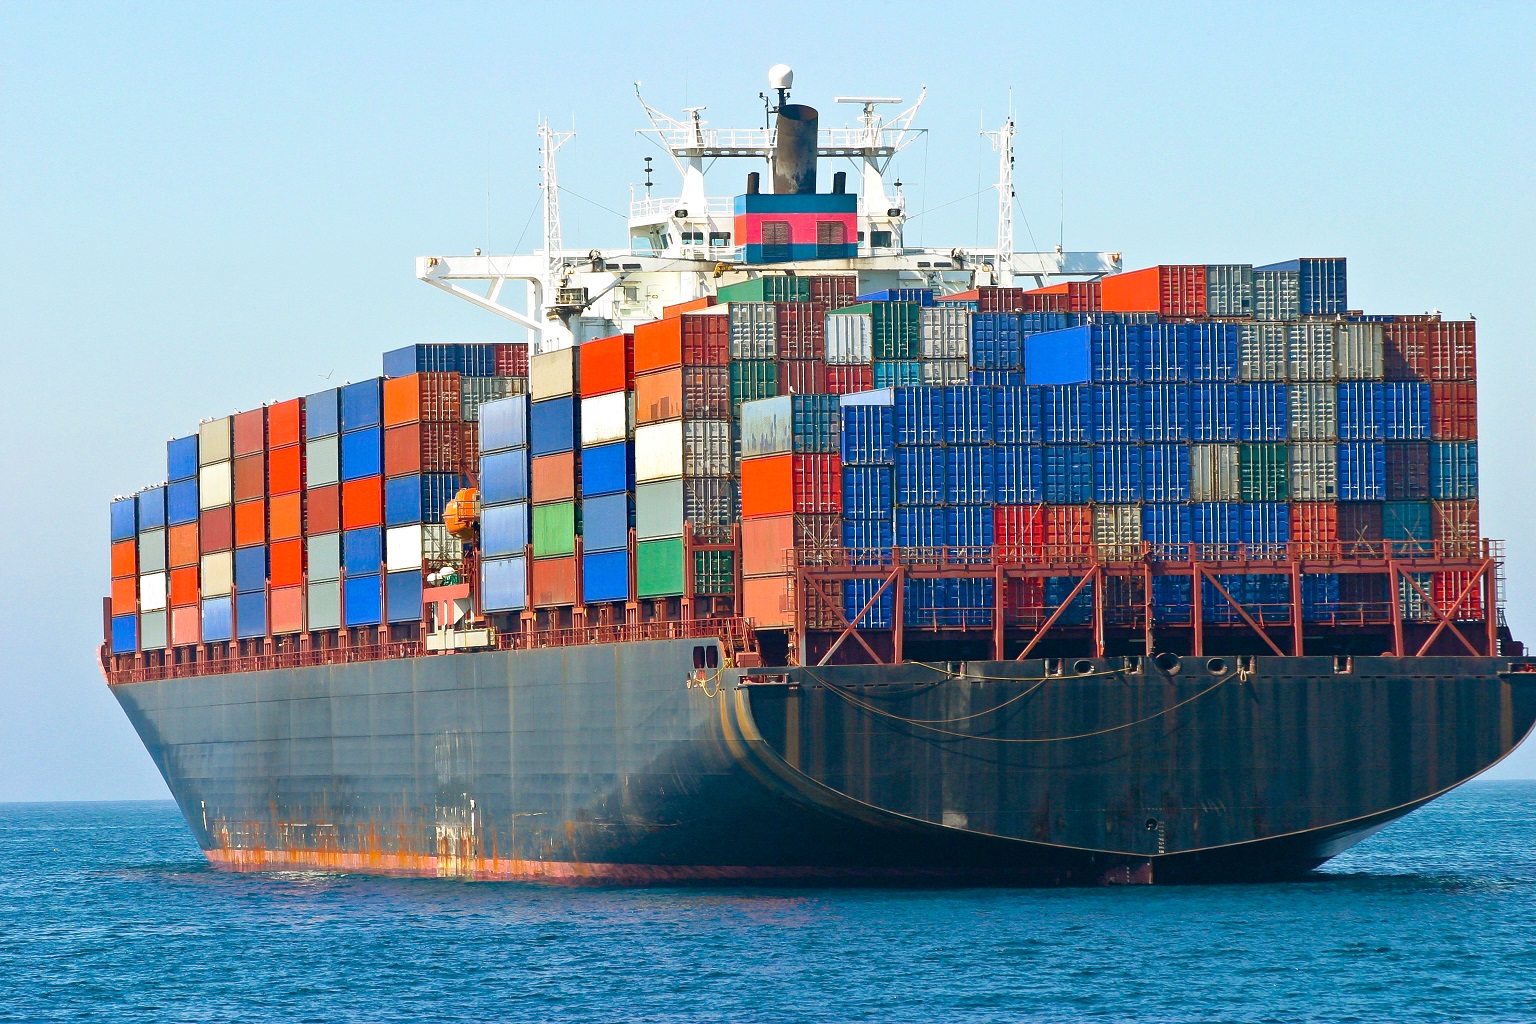
Rising costs and constrained shipping capacity is driving inflation and disrupting supply chain across the economy. Image courtesy of Adobe Stock.
Indicators I can see suggest inflation is going to continue at a high rate for quite some time. Here are a few of the articles I have read recently pointing towards ongoing rise in prices:
Rent component of CPI will increase substantially over the next year because of the way the index is calculated.
Shipping costs have already skyrocketed.
Multiple food producers are struggling with rapidly increasing costs.
Major food producer expects their costs go up 11% in the next year with prices they charge to go up by 4%.
The phrase “stagflation” is back in play. Oh joy, a possible (likely?) return to the Carter administration.
A friend of mine priced the apartment they are living in to help a relative who was moving into the area. Price for this exact unit is 50% more than when they signed their annual lease a number of months ago.
An acquaintance reports the price for renting a particular house went up while they were thinking about it for a day or so.
Two friends report landlords renting apartments expect six months rent in advance and some landlords renting houses are expecting a year in advance. A year.
Article mentioned above says the reports floating around in the media indicate rent hikes overall are around 10%. Yet the CPI shows only 2% increase in rent.
How can that be?
Fascinating detail of how the CPI is calculated explains the anomaly and also points towards dramatic increase in the rent component of CPI over the next year.
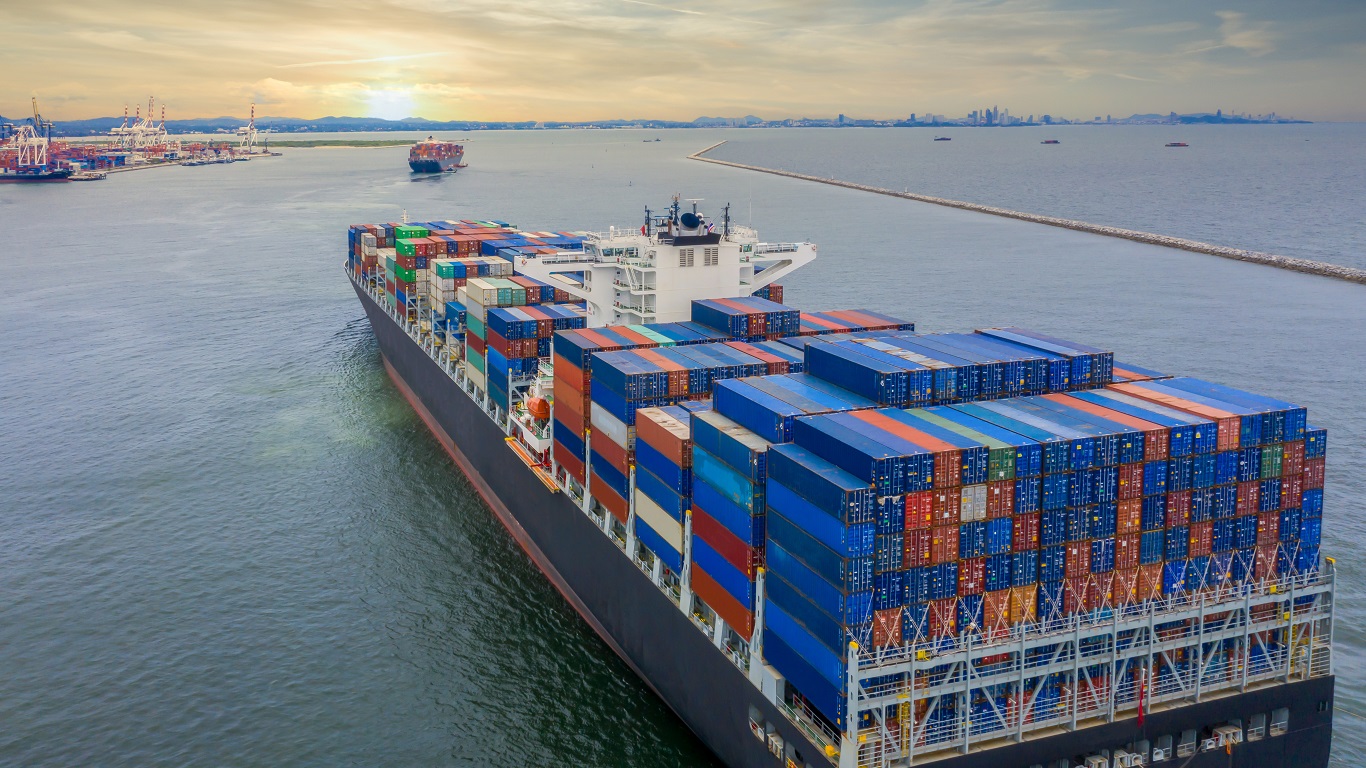
Modern cargo container ship giving an idea of the amount of cargo that can be carried. Each of those containers is one semi-load on the freeway. Image courtesy of Adobe Stock.
Seems like most industries have a tangled supply chain. The entire transportation system is sorely distressed.
The elitists in federal and state governments have a staggering level of hubris. They think waving their hands, clicking on their laptops, issuing press releases will make the entire economy bend to their will. What they accomplish is willfully causing disruption in your life and in my life.
Here are merely a few of the recent articles describing the tangled impact of Covid dictats and sundry government policies:
Lots of cargo ships are waiting to unload off the California coast.
Large port operator expects disruptions to last into 2023.
Workers in transportation sector warn of possible system collapse.
Chip shortage for carmakers will last into late 2022.
Looks like it might take another 15 or 18 months to untangle the worldwide supply chain.
A tweet I saw this morning (10/9/21) from someone flying out of Long Beach indicated the individual counted 50 ships waiting to unload.
At around 10,000 containers per ship that is somewhere around 370,000 containers waiting to be unloaded back in the middle of August and is now currently somewhere in the range of half a million containers sitting off the coast.
Article says a few months ago it was only nine. Normally it is zero.
Random stock outages are still common. Image courtesy of Adobe Stock.
The supply chain in most industries is tangled up somehow somewhere.
The people in federal and state governments with the staggering level of hubris to think they can wave their hands and make the entire economy do their bidding are willfully causing disruption in your life and in my life.
I am struggling to figure out what’s going on around us in the economy. These are confusing times.
That is why I blog. Digging into news reports and statistics deep enough to write something coherent (hopefully) pushes me towards understanding. At least that’s the concept.
The next several posts I have lined up will explore some economics aspects of this confusing world.