economic indicators

Monitoring inflation through the Personal Consumption Expenditure (PCE) price index.

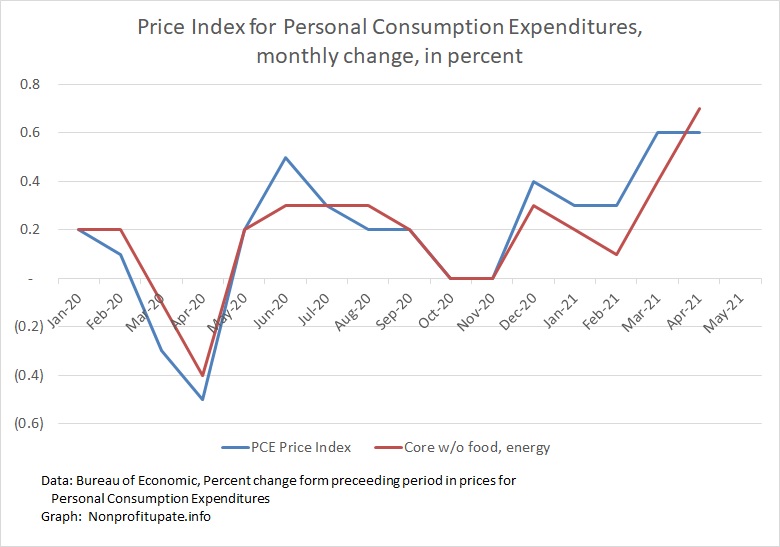
Another way to keep track of inflation trends is by watching the price index for the Personal Consumption Expenditure.

Please journey along with me as I continue my education.

In the news yesterday was the April increase which showed a 3.1% year-over-year increase compared to an expectation of a 2.9% increase. For one article discussing the news, check out the following:

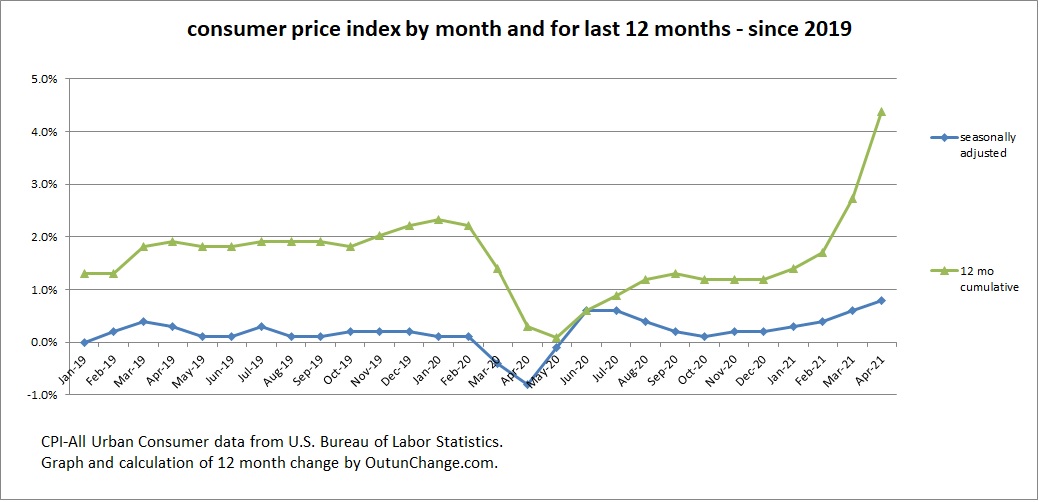
I have started to track this data, gathering information back to the start of 2020. The month by month change in the headline index and the core index (which excludes food and energy costs) can be seen in the graph at the top of this post.

Before look at the year-over-year change, we need to look at the nature of the index. There are two main indices used to monitor inflation. The first is the Consumer Price Index (CPI) which everyone knows about. The other is the Personal Consumption Expenditures (PCE).

What’s the difference? Great question.

New claims for unemployment decreasing at end of in May 2021. Ongoing claims are flat.

Since my last post on 4/30/20, a month ago, there has finally been visible progress in the number of people losing their job.

Since 4/24/21 the number of new claims for unemployment has dropped from 590,000 to 406,000 in the week ending 5/22/21. Graph above shows improvement. Average had been running around 800,000 from early October 2020 until late in February 2021.

The number of new claims is still double the average from before the pandemic. As recently as February it was four times, so that is progress. From quadruple for oh so many months to merely double is good. Not great for all those people losing their job now, but at overall level it is progress.

Purpose of these posts on economic statistics is to help all of us sort out what is going on in the overall economy.

Revised number of new claims in state programs over the last four months:

  • 754K – 2/27/21
  • 728K – 3/27/221
  • 590K – 4/24/21
  • 406K – 5/22/21

Following graphs show the ongoing human cost of the economic shutdown.

New claims

New claims for unemployment by week since the start of 2020:

Background on the inflation environment.

Image courtesy of Adobe Stock.

Previous post suggested It’s time to start monitoring inflation. The dramatic increase in inflation rate in March and April 2021 suggests we need to be watching the inflation numbers more closely.

Not only does this help us generally understand what is going on around us, but specifically it helps us understand and interpret our clients’ financial results as we provide audit and review services.

A few articles I have found helpful in the recent weeks providing context on the inflation environment:

5/5/21 – Wall Street JournalEverything Screams Inflation – Columnist senses a possible shifting point from the low inflation we have seen for a very long time, going back to a sustained period of high inflation.

He cites five general trends which point towards years of high inflation:

It’s time to start monitoring inflation.

As CPAs, we pay attention to economic trends because those have big impact on our client’s operations.  Understanding what is happening in terms of interest rates, growth or shrinkage in the GDP, unemployment trends, and real estate prices also helps us interpret financial statements during and audit or review.

It is time to start monitoring inflation rates.

Graph at the top of this post shows worrying information about inflation.

Continued struggles in recovery of job market.

Lots of companies are looking for new staff but can’t find enough workers. Image courtesy of Adobe Stock.

(Article cross-posted from Nonprofit Update to help accountants understand pressures our clients are facing.)

Spending by consumers is growing while the number of new jobs is not as strong as expected and employers are having a hard time finding enough staff.

5/7/21 – Wall Street Journal – U.S. Employers Added 266,000 Jobs in April as Hiring Slowed – Expectation among economic forecasters was employers would add 1 million new jobs in April. Actual results were a mere 266,000.

This follows a downward revision to the March data.

Leisure and hospitality (that means entertainment, hotels, and motels) saw most of the growth in April. In more detail, there are 331K new jobs in those sectors which offset a net decline of 65K in all other sectors.

Article repeats the comment seen in many of other articles that employers are having a hard time attracting new staff.

New claims for unemployment in week ending 3/13/21 are roughly same as last several months.

The number of new claims for unemployment for week ending 3/13/21 increased 45,000 after decling 29,000 the prior week. Those weekly changes are in the range of what has happened over the last six months. In other words, not a lot of improvement with plenty of ups and downs in the weekly new-claims tally.

Since 8/29/20, the new weekly claims ranged from a low of 711K to high of 965K. average since then is 812K. That means weekly new claims have been bad news for seven months in a row.

For context consider before the economic shutdown the new claims averaged about 220K per week, so after all these months of improvements we are still running about four times the previous norm.

Why this ongoing discussion?

If we’re going to understand what is happening in the economy we need to dive deeper into the numbers. For those of us who are CPAs providing audits and reviews, it helps us to have a deeper understanding of the overall economy.

Ponder the following graphs and you can make your own assessment.

News report

Total number of people drawing state and federal unemployment is declining slowly.

Image courtesy of Adobe Stock.

The number of people with continuing claims for unemployment in the regular state programs and Pandemic Emergency Unemployment compensation programs is volatile, showing large swings from week to week. However, the total does not seem to dropping very fast.

Since the week of 9/19/20, I have been pulling that data off the weekly press release from the Department of Labor. Current weekly report is: Unemployment insurance weekly claims.

The weekly data since then, excluding one week I missed, is:

New claims for unemployment increase again for week ending 2/13/21.

The number of new claims for unemployment for week ending 2/13/21 increased 13,000 after 36,000 increase the prior week. (Previous week numbers were revised upward by 55,000.)

This follows a two-week decline of 153K (1/16 and 1/23). Prior week of 1/9 saw a 181K increase.

New claims in state programs for the last three weeks: