economic indicators

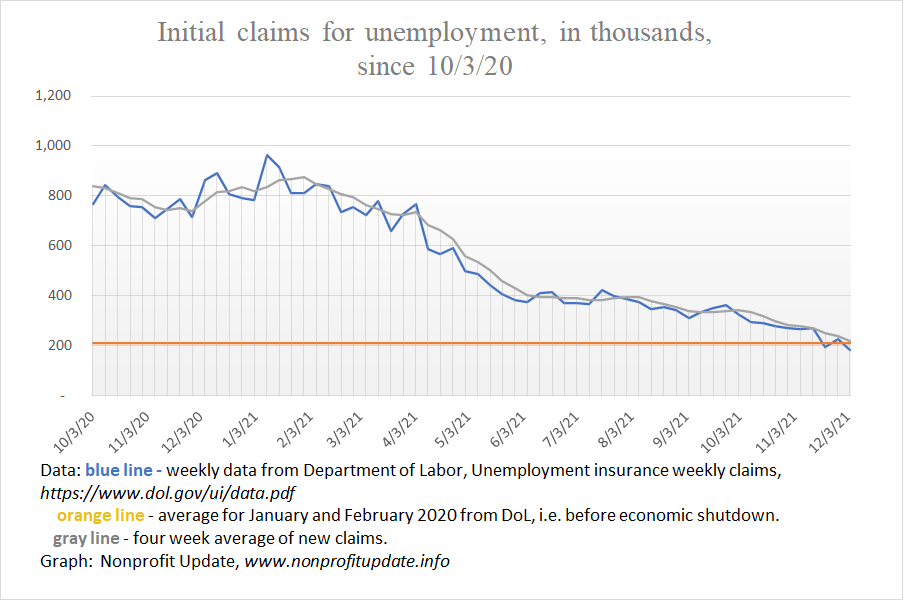
First-time claims for unemployment now below the level when the pandemic started. Ongoing claims for unemployment continuing to decline as of the end of November 2021.

Wow. Am I confused.

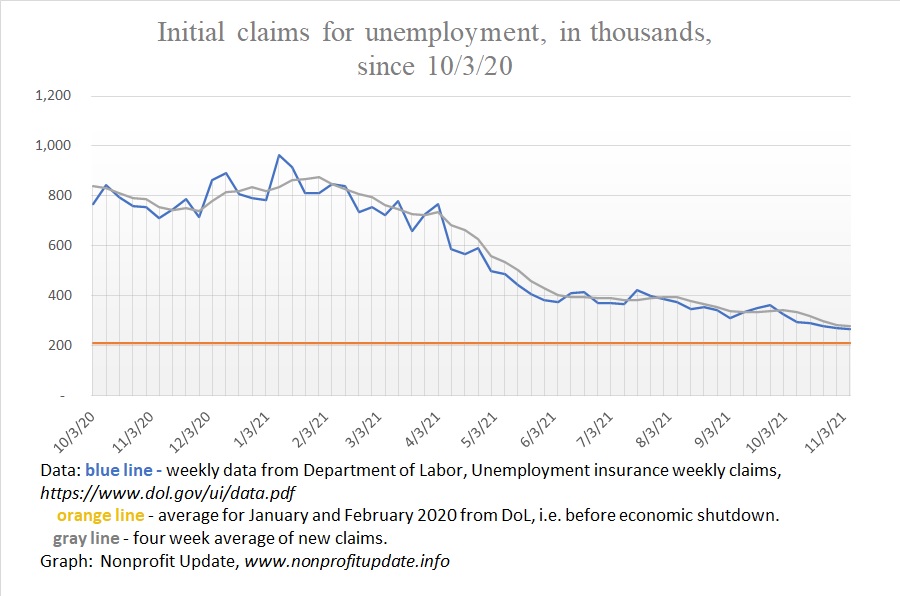
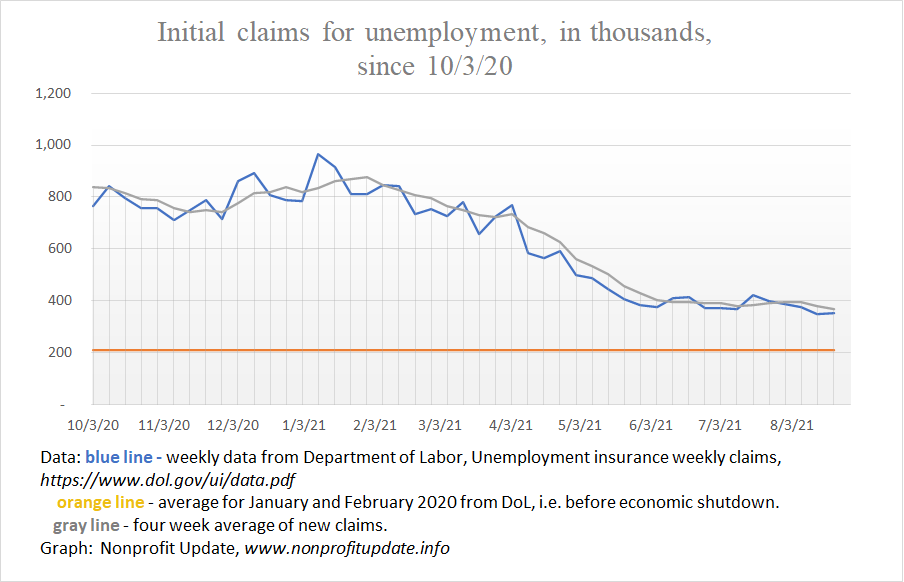
The number of people filing first-time claims for unemployment is now at the level before the pandemic started.

For the week ending 12/4/21 there were 184,000 new claims. The four-week average is 219,000 which is almost a match to the average of 212,000 average in January and February 2020.

The number of people drawing unemployment insurance is 1.99 million which shows a continual decline and is approaching the 1.72 million average before the pandemic.

Yet the civilian labor force is still 2 million below the start of the pandemic and the number of people not in the labor force is 5 million higher. Everywhere you look you see help wanted signs and in my tiny corner of the world I have seen restaurants cutting back service or closing in the middle of the workday. Everywhere you look you read about a massive shortage of staff.

Part of the explanation for this confusing picture is common to read about the surprisingly low number of new claims. Speculation in several articles I read is this reflects employers being very hesitant to let go of workers if they think they will be unable to find new staff if needed in the near-term.

For example, consider this report:

One of the reasons why we are seeing record setting high inflation: staggering, astronomical level of federal spending.

Image courtesy of Adobe Stock.

The amount of money Congress has pumped into the economy in an attempt to fight the Covid pandemic is staggering. Don’t quite have enough adjectives to describe the amount of money that is forced into the economy without any corresponding increase in production.

The amount spent directly on the pandemic is more than four times the annual budget at the federal level.

This is one of the primary reasons we are seeing inflation rates running at a thirty year high.

A close cousin on the list of inflation causes is the Fed flooding the economy with liquidity.  See previous discussion: Just how much money has the Federal Reserve created out of thin air and injected into the economy?

I’ve pulled together the amount of money appropriated by Congress in 2020 and 2021 which are focused on fighting the pandemic and stimulating the economy. Here is my tally, with amount of funding in billions of dollars, date Congress passed the legislation, and name of the program:

Personal Consumption Expenditure for September 2021 shows high inflation rate is continuing.

The Personal Consumption Expenditure (PCE) inflation index increased 0.6% October 2021.  This is a jump from the 0.4% in July, August, and September.  The 0.6% matches the increase in March and April.

The core PCE inflation rate was 0.4% in October which is in the middle of the range from March 2021 through September.

This indicates inflation is continuing and perhaps accelerating.

The cumulative 12 month change, according to BEA, has risen to 5.0% for the 12 months through October 2021, compared to 4.2% for the 12 months ending September.

Number of people drawing unemployment continues to improve, but very slowly, as of the start of November 2021.

The number of new claims for unemployment is slowly declining.

For the week ending 11/6/21 there were 267,000 new claims. While this is encouraging progress, keep in mind the number of people who are getting laid off is still far above the average of 212,000 per week all the way back in January and February 2020. We are still seeing more people laid off every week than before the pandemic began.

Here is a recap of newly unemployed over the last several months:

Consumer Price Index increases 0.9% in October for the second time in 2021.

The Consumer Price Index (CPI) increased 0.9% in October 2021 after a more modest 0.4% increase in September and 0.2% in August.

The October increase matches the June increase of 0.9% and is slightly higher than April increase of 0.8%.

Diving into the components of the CPI shows the increases are broader than several months ago.

The press release from the Bureau of Labor Statistics explains:

“The monthly all items seasonally adjusted increase was broad-based, with increases in the indexes for energy, shelter, food, used cars and trucks, and new vehicles among the larger contributors. The energy index rose 4.8 percent over the month, as the gasoline index increased 6.1 percent and the other major energy component indexes also rose. The food index increased 0.9 percent as the index for food at home rose 1.0 percent. “

Warning sign as we roll into winter is fuel oil increased 12.3% in October and utility gas increased 6.6%. Keep in mind those are changes for the month, not for the year.

Producer Price Index in October 2021 shows continuing inflation.

The Producer Price Index (PPI) in October 2021 continues to show unusually high and ongoing inflation. Increasing October was 0.6%, which follows a 0.5% increase in September and 0.7% increase in August.

The PPI has shown high inflation for all of 2021. The worst months were 1.2% in January, 1.0% in April, and 1.0% in July. Those extremes have not repeated for the last quarter, which is a small amount of good news.

Graph at the top of this post shows the monthly change and final demand (the total index in other words) in blue. The average of the monthly changes in green. The red line shows core change, which excludes food, energy, and trade.

The PPI was increasing around 0.4% the month until the end of 2020. Since then it has averaged 0.8% for 2021 through October. Ouch.

This index is explained by the Bureau of Labor Statistics as follows:

Consumer Price Index increase for September 2021 continues strong, with 12 month inflation running at worst rate since 1990.

The Consumer Price Index, or CPI, shows a 0.4% increase in September 2021 for all-items with a core increase of 0.2%.

The rate of inflation for the last 12 months is 5.43% for all items and 3.86% for core inflation without food and energy.

Graph at top of this post shows the monthly increase in the all-items index along with the core change. Graph also shows an average of the preceding 12 months for all items.

Watch the green line increase from around 0.1% up to over 0.4% for the last five months.

The trailing 12 month average is also grim. It shows:

What’s likely to happen with inflation? More of it and for extended time.

Rising costs and constrained shipping capacity is driving inflation and disrupting supply chain across the economy. Image courtesy of Adobe Stock.

Indicators I can see suggest inflation is going to continue at a high rate for quite some time. Here are a few of the articles I have read recently pointing towards ongoing rise in prices:

  • Rent component of CPI will increase substantially over the next year because of the way the index is calculated.
  • Shipping costs have already skyrocketed.
  • Multiple food producers are struggling with rapidly increasing costs.
  • Major food producer expects their costs go up 11% in the next year with prices they charge to go up by 4%.
  • The phrase “stagflation” is back in play. Oh joy, a possible (likely?) return to the Carter administration.

Asia Times – 8/27/21 – US rent hikes will explode consumer inflation in 2022 – Anecdotal information indicates rental prices are skyrocketing.

A friend of mine priced the apartment they are living in to help a relative who was moving into the area. Price for this exact unit is 50% more than when they signed their annual lease a number of months ago.

An acquaintance reports the price for renting a particular house went up while they were thinking about it for a day or so.

Two friends report landlords renting apartments expect six months rent in advance and some landlords renting houses are expecting a year in advance. A year.

Article mentioned above says the reports floating around in the media indicate rent hikes overall are around 10%. Yet the CPI shows only 2% increase in rent.

How can that be?

Fascinating detail of how the CPI is calculated explains the anomaly and also points towards dramatic increase in the rent component of CPI over the next year.

Personal Consumption Expenditure for July 2021 shows increased inflation is still in play.

The Personal Consumption Expenditure (PCE) inflation index shows an increase of 0.4% in July 2021. Since December 2020 this index is shown inflation of between 0.3% and 0.6% each month.

This indicates that inflation is continuing. Good news is that inflation is not accelerating. Bad news is an annualized inflation rate of about 6% is continuing.

The PCE is the inflation index preferred by the US Federal Reserve. An intriguing aspect of the PCE is the numbers are routinely revised. This means prior month’s numbers will shift, sometimes by substantial amounts.

Update: The year over year change in PCE is 3.6%. CNBC reports on 8/28/31 Key inflation gauge rises 3.6% from a year ago to tie biggest jump since the early 1990s. To be specific that matches the increase in May 1991 and is second only to the 4.2% increase in January 1991. Current policies of the White House and Congress have given us the highest inflation in 30 years. Not yet Carter era bad, but there is time to achieve Carter level performance.

The CNBC article also says some of the Fed members are starting to see the immediate inflation just might be more than just a temporary adjustment to the economic shutdown. President of the Atlanta Fed acknowledge such possibility when he said on-air that he is hearing from a many of his business contacts that they expect inflation go to beyond the immediate-term.

Very slow but steady improvement in unemployment as of early August 2021.

New claims for unemployment are down about 60,000 per week since my last post 10 weeks ago. For the week ending 8/21/21 new claims were 353K compared to 412K the week of 6/12/21.

The number of insured unemployed has dropped more substantially, from 3.53M the week ending 6/12/21 to 2.9M the week ending 8/14/21. That is a drop of 672K over nine weeks. For contrast the number of insured unemployed was averaging 1.7M in January and February 2020.

Those numbers reveal a slow improvement although the number of people losing their jobs each week is still running double the average in January and February 2020.

Purpose of these posts on economic statistics is to help all of us keep current on what is going on in the overall economy.

What I’m drawing from the data is the economy is improving one little bit at a time. Seems to me the recovery is slowing.

Revised number of weekly new claims in state programs over recent months shows following trend:

  • 406K – 5/22/21
  • 412K – 6/12/21
  • 368K – 7/10/21
  • 349K – 8/14/21

Following graphs show the devastation from the economic shutdown.

New claims

New claims for unemployment by week since the start of 2020:

Consumer Price Index again showing strong inflation in July 2021.

The Consumer Price Index, or CPI, shows 0.5% price increases in July with a core increase of 0.3%. While that is the lowest increase since February 2021, half a percent in one month works out to about 6% in a year.

Graph at top of this post shows the monthly change in the primary index along with the core change which excludes food and energy. Graph also shows an average of the preceding 12 months.

The average was running around 0.1% a month for most of 2020 after the shock of the pandemic. You can see the rising monthly increase quite visibly, starting in January 2021. Watch the green line increase from around 0.1% up to currently 0.4%.

The trailing 12 month average is also grim. It shows:

Expectations growing that we will see rising interest rates and sustained inflation.

Image courtesy of Adobe Stock.

It isn’t just the current numbers that are hinting that inflation is back. Changes in CPI and PCE are unsettling.

There is also a clear statement from the Fed they will nudge interest rates up earlier than they previous announced. Also indications from two big banks that we will see rising interest rates.

6/17/21 – Dailywire – Federal Reserve Delivers Bad News About Expectations For Inflation, Raising Interest Rates: Report – Previously the Federal Reserve indicated interest rates would not have to be increased until sometime in 2024.

New claims for unemployment are flat and ongoing claims are slowly decreasing as of middle of June 2021.

New claims for unemployment are flat compared to three weeks ago. Ongoing claims for unemployment at the state and federal level are declining, slow though the decline may be.

Number of weekly new claims for unemployment was 406,000 three weeks ago and 412,000 the most recent week. The increase in the most recent week offset the decline in the previous two weeks.

Most recent data shows ongoing claims at the state level dropped from 3,602,000 three weeks ago to 3,518,000 in the most recent week, for a net decrease of 84,000. There was an increase two weeks ago, large drop last week, and essentially no change this week.

The number of new claims is still double the average from before the pandemic.

Purpose of these posts on economic statistics is to help all of us keep current on what is going on in the overall economy.

Revised number of weekly new claims in state programs over the last four months to show the trend:

  • 728K – 3/27/221
  • 590K – 4/24/21
  • 406K – 5/22/21
  • 412K – 6/12/21

Following graphs show the devastation from the economic shutdown.

New claims

New claims for unemployment by week since the start of 2020:

Accelerating inflation rate continues in May 2021.

Changes in the Consumer Price Index have been making a splash in the news lately. Increases over the last three months have been unusually high.

The headline consumer price indicator increased 0.6% in May after 0.8% in April and 0.6% in March. That is a big run of inflation for three months.

The core measure, which excludes energy and food costs, has been on a roughly parallel track with 0.7 increase in May following a 0.9% in April and 0.3% in March.

Graph at the top of this page shows the change in the primary inflation indicator, and the core index along with a 12 month average of the monthly change.

You can see a large drop in prices during the pandemic followed by spikes over the next several months. Price changes returned to normal range in the September 2020 through February 2021 timeframe.

What is behind those numbers? Let’s check out the Wall Street Journal’s narrative: